Building production dashboards by talking to Axiom through MCP
How I stopped hand-clicking charts, let an AI assistant write the APL queries and call createDashboard, and ended up with error-rate and latency dashboards across four services.

Raw trace data is not observability
When you run software for other people, it constantly emits small records of what it is doing: this request took 800 milliseconds, this one failed, this one called the database twice. That stream is telemetry, and observability is the practice of answering questions about your system from it. We store ours in Axiom.
A pile of records is not an answer, though. You can query it, but every question means writing a query by hand in APL, Axiom’s query language. A dashboard is the opposite: a set of always-on charts that answer the important questions at a glance.
Think of a shoebox of receipts. The answer to “which supplier costs us the most in late deliveries?” is technically in there, but finding it means emptying the box and sorting by hand every time. A dashboard is the monthly summary taped to the wall.
Building dashboards by hand was a day of clicking
I needed those wall charts for our production system. Building them the normal way meant the better part of a day in the UI: pick a chart type, write the query, fix the time range, name the axes, repeat. It was tedious enough that I kept putting it off, which is the real risk. The dashboards you never build are the ones you wish you had at 2 a.m. during an incident.
Using an MCP server from the coding environment
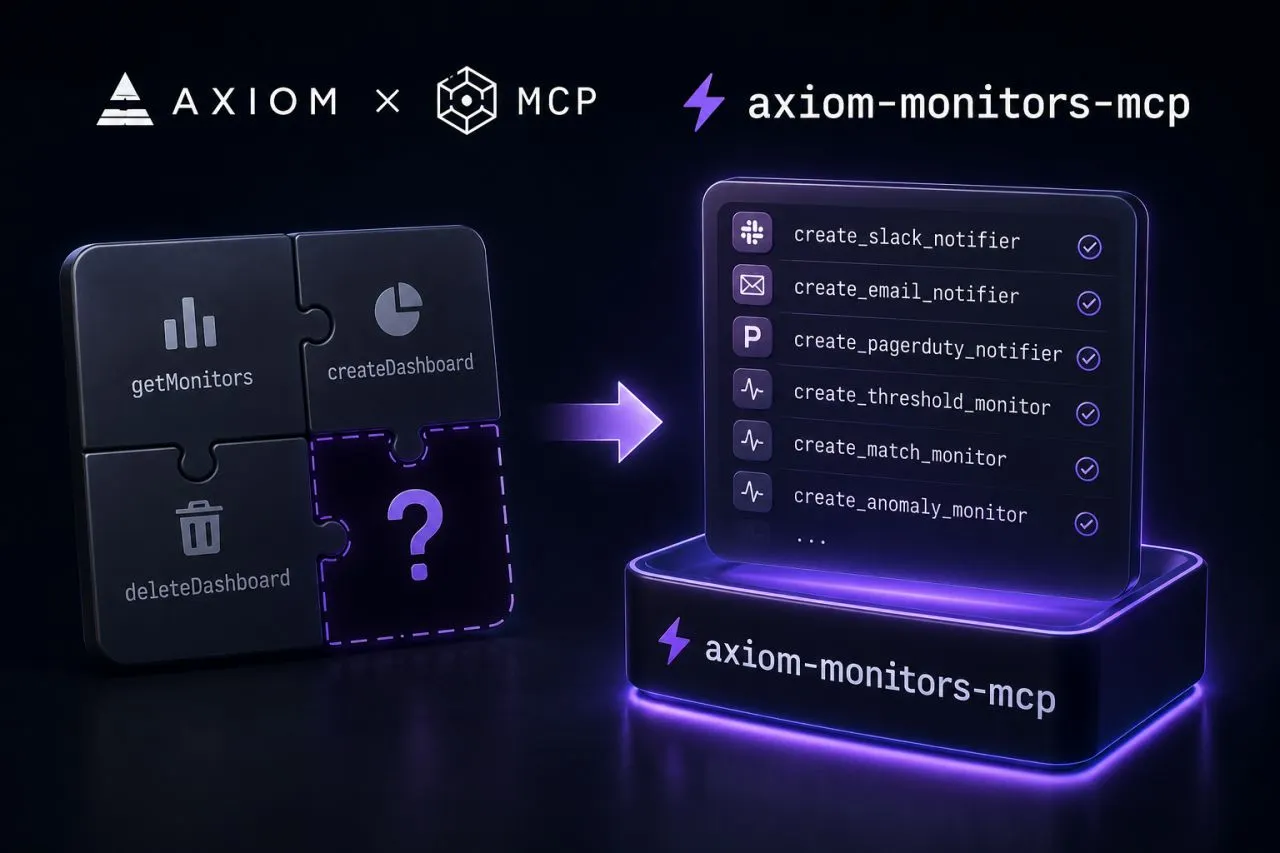
Instead, I used an MCP server inside my coding environment. MCP is a standard way to give an AI assistant a set of real controls on another tool, not screenshots and not copy-paste, but the tool’s actual operations.
It is like hiring an assistant who is fluent in a filing system you only half speak. Before, I operated every drawer myself. With MCP, I say what I want pulled and the assistant does it.
Get Aman Srivastava’s stories in your inbox
Join Medium for free to get updates from this writer.
So I described what I wanted in plain English. The AI wrote the APL queries, built the chart specifications and called Axiom’s own createDashboard operation directly. I reviewed what it produced, asked for tweaks, and it patched them. No switching windows, no pasting query strings back and forth.
Two dashboards in production
- Error rates across all four services, filterable by service and operation, refreshing every 60 seconds.
- Response-time percentiles for every service and operation, over a rolling 24 hours: p50 (the median, the typical request), p95 (95% of requests were faster than this) and p99 (99% were faster, so it shows the slow tail).


The error-rate dashboard went in without problems. The latency dashboard took three rounds: the first version bucketed time incorrectly, the second broke on empty datasets, and the third worked. I read the JSON, asked for changes, and the assistant patched it. Each round was a conversation, not a rebuild.
When asking is cheap, you ask for more
Once asking was cheap, I started requesting charts I would never have built by hand: which service contributes most to the slowest requests, and which operations have a p99 more than twice their p95. Each would have taken about 30 minutes to express in APL. Answered this way, they took seconds.
That is the bigger lesson, beyond speed. When the effort of building something drops far enough, “is this worth building?” starts coming back yes far more often. The tool did not only make me faster. It lowered the bar until I actually did the thing.
I write about building backend and AI systems in production. Connect with me on LinkedIn or see my work on my portfolio.