Data Visualization Using Power BI
Introduction
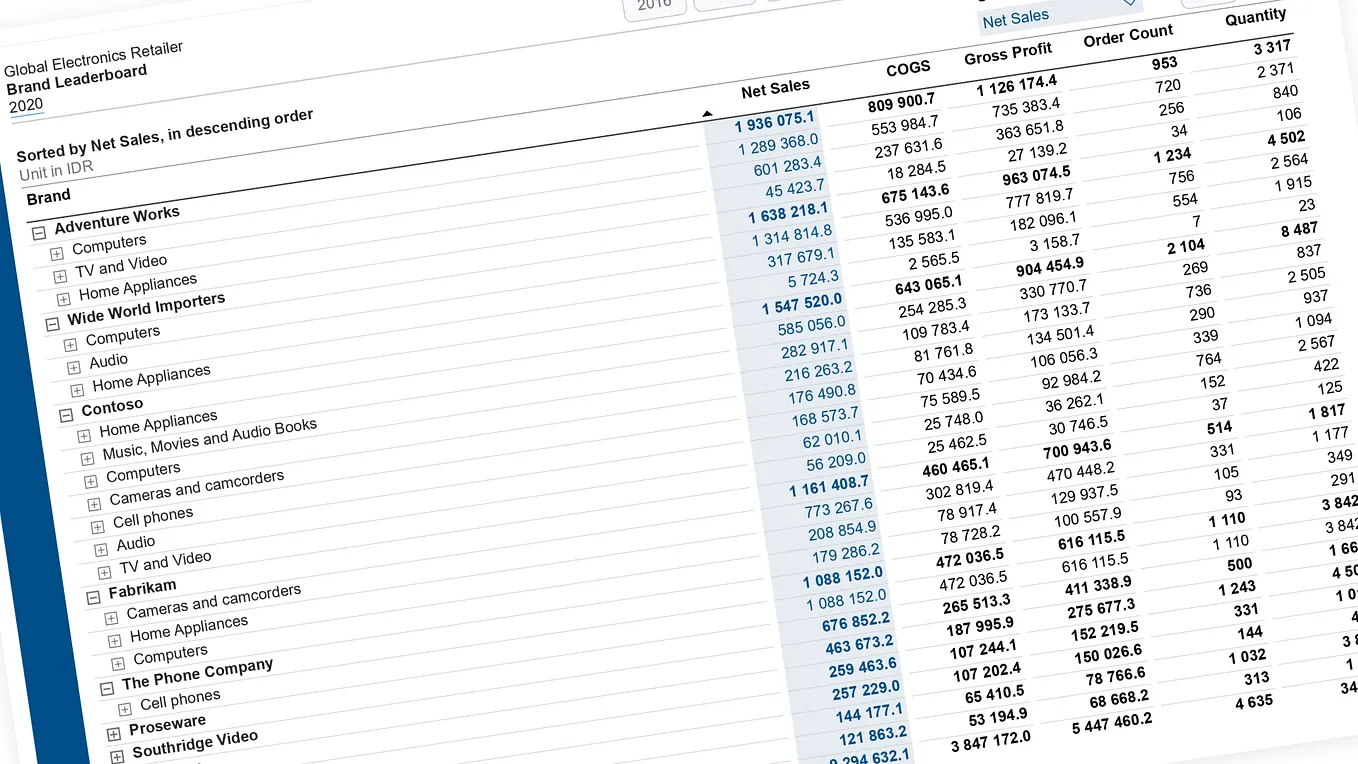
In today’s data-driven world, organizations generate huge amounts of data every day. However, raw data in the form of tables and spreadsheets can be difficult to understand and analyze. Data visualization helps transform this complex data into meaningful charts, graphs, dashboards, and reports.
Microsoft Power BI is one of the most widely used business intelligence and data visualization tools. It enables users to connect to different data sources, analyze information, and create interactive reports and dashboards that support better business decisions.

What is Data Visualization?
Data visualization is the process of representing data graphically using visual elements such as:
· Bar charts
· Column charts
· Line charts
· Pie and donut charts
· Maps
· Tables and matrices
· KPI cards
· Scatter charts
· Interactive dashboards
Instead of looking at hundreds or thousands of rows of data, users can quickly identify trends, patterns, comparisons, and relationships through visualizations.
For example, a company’s monthly sales data can be represented using a line chart to understand whether sales are increasing or decreasing over time.
What is Power BI?
Power BI is a business analytics and data visualization platform from Microsoft. It allows users to connect to various data sources, clean and transform data, create data models, and build interactive reports and dashboards.

Power BI can work with data from sources such as:
· Excel
· CSV files
· SQL Server
· Microsoft Access
· SharePoint
· Web sources
· Cloud databases
· Other business applications
Its user-friendly interface makes it useful for both technical and non-technical users.
Key Components of Power BI
Power BI consists of several important components:
1. Power BI Desktop
Power BI Desktop is primarily used to connect to data, transform it, create data models, and design reports.
2. Power Query
Power Query is used for data cleaning and transformation. It can be used to remove duplicates, change data types, replace values, merge tables, and perform other data preparation tasks.
3. Data Model
The data model defines relationships between different tables. A well-designed model helps users perform accurate analysis and create efficient reports.
4. DAX
DAX (Data Analysis Expressions) is a formula language used in Power BI to create calculated columns, measures, and advanced calculations.
For example:
Total Sales = SUM(Sales[Sales Amount])
5. Power BI Service
Power BI Service is a cloud-based platform where reports and dashboards can be published, shared, and accessed by authorized users.
Steps to Create a Visualization in Power BI

Creating a visualization in Power BI generally involves the following steps:
Step 1: Import the Data
First, connect Power BI to a data source such as an Excel file, CSV file, or database.
Step 2: Clean the Data
Use Power Query to prepare the data. This may include:
· Removing unnecessary columns
· Removing duplicate records
· Handling missing values
· Changing data types
· Renaming columns
· Combining tables
Step 3: Create Relationships
If the dataset contains multiple tables, create relationships between related fields. For example, a Customer ID can connect a customer table with a sales table.
Step 4: Create Measures
DAX measures can be created to calculate important business metrics such as total sales, average sales, profit, and growth percentage.
Example:
Total Sales = SUM (Sales [Sales Amount])
Step 5: Select Visualizations
Choose an appropriate visual based on the type of analysis required.
For example:
Requirement
Suitable Visualization
Compare categories
Get BAGYA K’s stories in your inbox
Join Medium for free to get updates from this writer.
Bar/Column Chart
Show trends over time
Line Chart
Show percentage contribution
Pie/Donut Chart
Show geographical data
Map
Show important numbers
KPI/Card
Analyze relationships
Scatter Chart
Display detailed data
Table/Matrix
Step 6: Add Filters and Slicers
Slicers allow users to interactively filter reports. For example, a sales dashboard can be filtered by:
· Year
· Month
· Region
· Product
· Customer
Step 7: Design the Dashboard
Arrange the visualizations in a logical and easy-to-understand layout. Use appropriate titles, labels, filters, and formatting.
Example: Sales Dashboard
Consider a company that has sales data containing:
· Product
· Region
· Sales Amount
· Quantity
· Customer
· Date
A Power BI dashboard could include:
Total Sales: A card showing overall sales.
Sales by Region: A bar chart comparing sales across different regions.
Monthly Sales: A line chart showing sales trends over time.
Product Contribution: A donut chart showing the percentage contribution of different products.
Sales by City: A map displaying geographical sales distribution.
These visualizations allow management to understand business performance quickly.
Benefits of Data Visualization Using Power BI

1. Easy Understanding
Visual representations make complex information easier to understand.
2. Faster Decision-Making
Important trends and patterns can be identified quickly.
3. Interactive Reports
Users can interact with dashboards using slicers, filters, and drill-down features.
4. Multiple Data Sources
Power BI can combine information from different data sources into a single report.
5. Real-Time Insights
Depending on the data source and configuration, Power BI can support regularly refreshed or real-time reporting.
6. Better Business Analysis
Organizations can monitor key performance indicators and identify areas that require attention.
Best Practices for Power BI Visualization
To create effective dashboards, it is important to follow some basic practices:
1. Choose the visualization according to the data and purpose.
2. Avoid unnecessary charts and visual elements.
3. Keep the dashboard simple and easy to navigate.
4. Use meaningful titles and labels.
5. Maintain consistent formatting.
6. Highlight important KPIs.
7. Use filters and slicers carefully.
8. Ensure that the data is clean and accurate.
9. Avoid overcrowding a single report page.
10. Focus on the business question that the visualization needs to answer.
Conclusion
Data visualization plays an important role in converting raw data into meaningful information. Power BI provides a powerful platform for connecting data, transforming it, analyzing it, and presenting it through interactive reports and dashboards.
By using appropriate charts, DAX calculations, filters, slicers, and interactive features, organizations can explore their data more effectively and communicate insights clearly.
In conclusion, Power BI makes data analysis more visual, interactive, and accessible, helping users transform data into valuable insights for informed decision-making.
Future Scope
As organizations continue to generate larger volumes of data, the importance of business intelligence and data visualization is expected to grow. Power BI’s integration with cloud services, advanced analytics, automation, and AI-based capabilities provides opportunities for organizations to build increasingly sophisticated analytical solutions.
Learning Power BI along with Excel, SQL, Python, and basic data analytics concepts can provide a strong foundation for developing practical data-analysis skills.