Evaluation Metrics for Classification and Regression in Machine Learning
Introduction
Building a machine learning model is not the final step in a machine learning project. After training a model, we need to evaluate its performance to understand how well it predicts unseen data.
Evaluation metrics help us measure the difference between actual values and predicted values. They also help us compare different models and select the most suitable one for a particular problem.
Evaluation metrics are mainly divided into two categories:
- Classification Evaluation Metrics
- Regression Evaluation Metrics
1. Classification Evaluation Metrics
Classification is a supervised machine learning task where the target variable contains predefined categories or classes.
Some commonly used classification metrics are Accuracy, Precision, Recall, F1-Score, Specificity, and ROC-AUC.
- Confusion Matrix
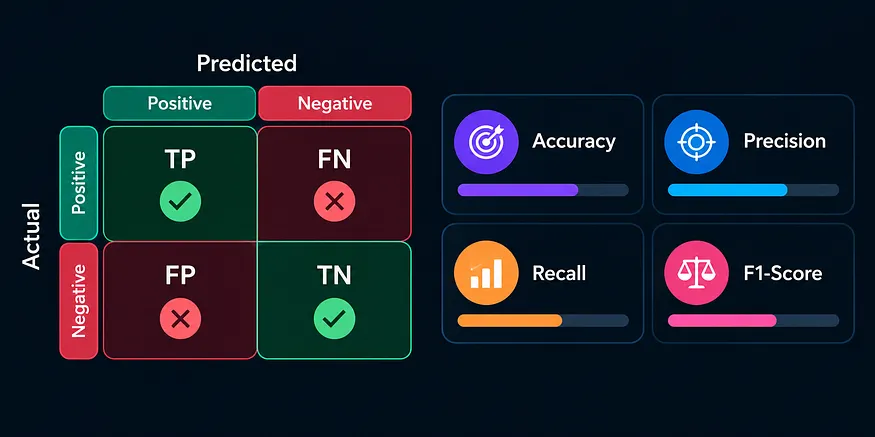
A Confusion Matrix is used to evaluate the performance of a classification model by comparing actual values with predicted values.
It contains four important components:
- TermMeaningTrue Positive (TP)- Actual positive correctly predicted as positive.
2. True Negative (TN)Actual negative correctly predicted as negative.
3. False Positive (FP)Actual negative incorrectly predicted as positive.
4. False Negative (FN)Actual positive incorrectly predicted as negative.
These four values form the foundation for calculating classification evaluation metrics.
1.2 Accuracy
Accuracy measures the proportion of correctly predicted observations out of the total observations.
Formula:
Accuracy = TP+TN/{TP+TN+FP+FN}Accuracy is useful when the dataset is balanced and both classes are equally important. However, it can be misleading when dealing with imbalanced datasets.
1.3 Precision
Precision measures how many predicted positive observations are actually positive.
Formula:
Precision ={TP}/{TP+FP}Higher precision means fewer false positive predictions.
It is useful when incorrect positive predictions need to be minimized.
1.4 Recall (Sensitivity)
Recall measures how many actual positive observations are correctly identified by the model.
Formula :
Recall = {TP}/{TP+FN}Higher recall means fewer actual positive cases are missed by the model.
It is important in applications where missing positive cases can be costly.
1.5 F1-Score
F1-Score is the harmonic mean of Precision and Recall.
It provides a balance between these two metrics.
Formula:
f1-score= 2 × (Precision × Recall) / (Precision + Recall)F1-Score is particularly useful when working with imbalanced datasets and when both false positives and false negatives matter.
ROC Curve and AUC
ROC stands for Receiver Operating Characteristic.
The ROC curve evaluates a binary classification model at different classification thresholds.
It plots:
- True Positive Rate (TPR) on the Y-axis.
- False Positive Rate (FPR) on the X-axis.
AUC stands for Area Under the Curve. It measures how well a model distinguishes between positive and negative classes.
AUC Interpretation:
AUC ScorePerformance1.0Perfect
0.9–1.0Excellent
0.8–0.9Good
0.7–0.8Fair
0.5 Random-level discrimination
Below 0.5 Worse than random ranking
2. Regression Evaluation Metrics
Regression is a supervised machine learning task where the target variable contains continuous numerical values.
Get Bhaskar Gampala’s stories in your inbox
Join Medium for free to get updates from this writer.
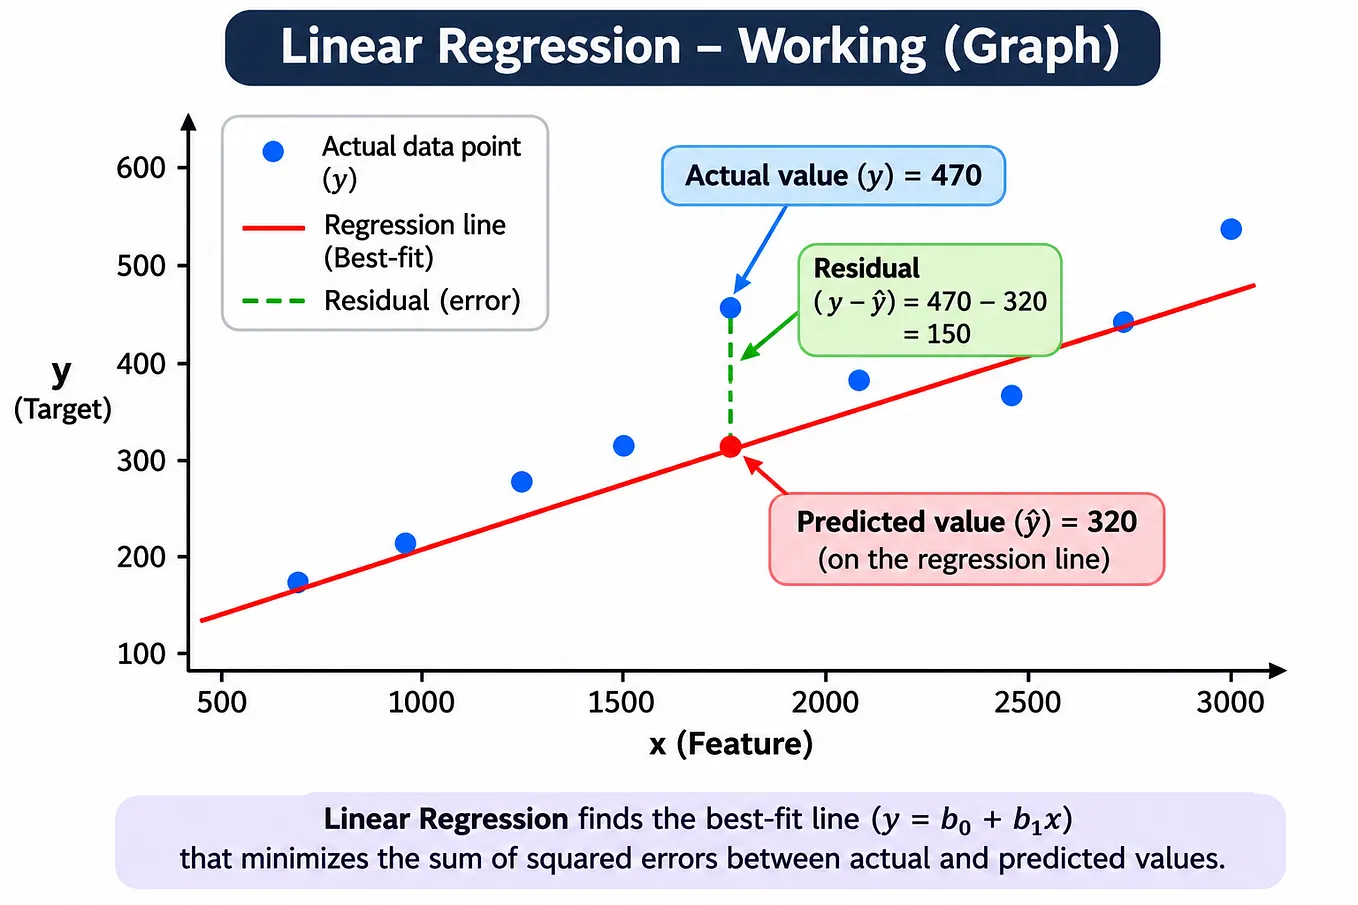
Regression evaluation metrics measure the difference between actual and predicted values.
The commonly used metrics are MAE, MSE, RMSE, R², and MAPE.
Mean Absolute Error (MAE)
MAE measures the average absolute difference between actual and predicted values.
It gives the average prediction error without considering the direction of the error.
Formula:
MAE = (1/n) × Σ |Actual Value − Predicted Value|Where:
- (n) = Total number of observations.
- (y_i) = Actual value.
A lower MAE indicates better prediction accuracy.
2.2 Mean Squared Error (MSE)
MSE measures the average squared difference between actual and predicted values.
Since errors are squared, larger prediction errors receive more weight.
Formula:
MSE = (1/n) × Σ (Actual Value − Predicted Value)²A lower MSE generally indicates better model performance.
2.3 Root Mean Squared Error (RMSE)
RMSE is the square root of Mean Squared Error.
It measures prediction errors in the same unit as the target variable.
Formula:
RMSE = √[(1/n) × Σ (Actual Value − Predicted Value)²]RMSE penalizes larger errors more heavily than MAE.
A lower RMSE indicates better prediction performance.
2.4 R-Squared (R² Score)
R-Squared, also called the Coefficient of Determination, measures how much variation in the target variable is explained by the regression model.
Formula:
R² = 1 − (SS_res / SS_tot)Where:
- (SS_{res}) = Sum of Squared Residuals.
- (SS_{tot}) = Total Sum of Squares.
Interpretation:
- R² = 1: Perfect fit.
- R² = 0: No improvement over predicting the target mean.
- R² below 0: Worse than the mean-prediction baseline.
A higher R² generally indicates that the model explains more variation in the target variable. However, it does not guarantee good performance on unseen data.
Mean Absolute Percentage Error (MAPE)
MAPE measures the average absolute prediction error as a percentage of actual values.
Formula:
MAPE = (100/n) × Σ |(Actual Value − Predicted Value) / Actual Value|MAPE is useful when we want to understand prediction errors in percentage terms.
However, it is undefined when actual values are zero and can be misleading when actual values are close to zero.
3. Difference Between Classification and Regression Metrics
ClassificationRegressionAccuracyMAEPrecisionMSERecallRMSEF1-ScoreR² ScoreSpecificityMAPEROC-AUC
Classification metrics evaluate how accurately a model predicts categories, whereas regression metrics measure the errors in numerical predictions.
4. How to Choose the Right Evaluation Metric?
Selecting an evaluation metric depends on the business problem and the type of errors we want to minimize.
RequirementSuitable MetricsOverall classification performanceAccuracyMinimize false positivesPrecisionMinimize false negativesRecallBalance Precision and RecallF1-ScoreEvaluate negative class identificationSpecificityCompare binary classification modelsROC-AUCMeasure average absolute errorMAEPenalize larger prediction errorsMSE / RMSEMeasure explained variationR²Measure percentage prediction errorMAPE
There is no single evaluation metric that is suitable for every machine learning problem. The choice depends on the dataset, business objective, and cost of incorrect predictions.

Conclusion
Evaluation metrics play an important role in machine learning because they help us understand how well a model performs.
Classification metrics such as Accuracy, Precision, Recall, F1-Score, and ROC-AUC evaluate predicted classes.
Regression metrics such as MAE, MSE, RMSE, R², and MAPE measure the difference between actual and predicted numerical values.Understanding these metrics helps us compare models, identify performance issues, and select the right model for real-world applications.
A model’s performance is not just about making predictions; it is about measuring how reliable those predictions are.