The 2022 Robredo People’s Campaign Map Series: Why and how I did it


This blog is two years too late, but I wanted to share why I channeled my energy towards creating and publishing election-related maps (or infogeographics, as quipped by one anonymous CuriousCat user) during the 2022 Philippine presidential campaign and how I was able to pull it off.
Okay, so here’s my why: I did it because I planned to do it six years before the election. It was during the tumultuous 2016 election cycles in the United States and the Philippines when I first truly dipped my toes into the realm of politics. That year, I was able to have the first opinion piece I’ve ever written published in a major broadsheet. After the Philippine election cycle wrapped up, I remained glued to every development in the American one. I read everything I could about the quirks of American politics, the primaries and caucuses, the infamous electoral college, the party conventions, and many more. I remember being mesmerized by the richness of the electoral data that American cable news networks had at their disposal. While obtaining national-level election data in the Philippines could be a chore, the Americans had precinct-level voter data at their fingertips (literally, because the major news networks had giant touchscreens to visualize such data)!
I was so jealous that I experimented with imaginary election data in the Philippines and began making my own “projections,” complete with à la CNN graphics (made with PowerPoint) and music. When my election-frenzy subsided, I promised that I would do a better job at making a difference come 2022.
Truth be told, while I did plan to do something election-data and mapping related during the 2022 Philippine presidential election, I had no clear idea of what form it would take or for which candidate I would do it (the latter was more difficult to predict). After giving things some thought, I identified five factors that defined how my effort turned out and made it possible.
1. A love of reading
I was the type of kid who, upon opening an encyclopedia set published in the 1970s, pretty much gave up playing on the streets with my kababata. I absolutely loved poring over the pages of those encyclopedias, and I carry with me my love of reading today. It proved vital to my interest in politics and in research. Culling large amounts of quantitative and qualitative data and information and determining whether their sources are trustworthy or not can take an awful lot of reading, checking, and double checking. When it came to finding the data or information I needed to make the infogeographics, it helped that I already had an idea where to look. It would have been much more difficult for me had I not spent years prior going down Wikipedia rabbit holes, obscure yet perfectly fine sources of information, and other nooks and crannies of the internet.
2. A fascination with maps
In fourth grade, when HEKASI focused on HEograpiya, my teacher assigned the class a project where we had to draw each of the Philippines’ then-17 regions and create mini-profiles for them. I was so pleased that I didn’t have to use tracing paper to draw over the maps and achieve an identical result; instead, I merely relied on short-term memory. From then on, I nurtured a fascination for maps, the shapes of continents, countries, and islands, and how geographic realities shaped our lives. Later on, when I began observing and commenting on elections, I realized that maps also had tremendous potential in illustrating data and making people understand better what the data said.
However, in 2016, I still didn’t have the map shape files I needed to create à la CNN electoral maps. As it turned out, this is where my research skills would come in handy. All of the SVG maps I used during the 2022 election cycle were from open-source repositories that I stumbled upon on the internet from 2016 to 2022. On the other hand, I did not have a grasp of a map’s technical features. It was a good thing that I took GEOG 1 as an undergraduate student in UP a year before I started making the infogeographics.
3. A knack for PowerPoint and other basic design tools
When I was in fifth grade, my school began installing projectors and projector screens in every classroom at school. Suddenly, the days of manila paper and chalkboards were over — PowerPoint was the future. At the time, we had a shared computer at home loaned to my family by my grandfather. I began experimenting with PowerPoint, figuring out not just how to apply a transition effect between slides, but also how to time them. The earliest PowerPoint presentation I remember creating was about the rock cycle. My classmates were so amazed with every transition that they began asking me which adult I asked to do it. I just smiled and proudly declared that I did it on my own.
My love affair with PowerPoint has endured despite the rise of Canva and other collaborative online design tools. I am proud of once creating an almost indistinguishable replica of CNN’s on-screen graphics (complete with movements for the inserts) for a tenth-grade school project sometime in 2016. Although I would like to learn how to use photoshop someday, I deemed PowerPoint enough for the purpose I had for the 2022 election cycle: Designing and layouting the infogeographics.
Aside from PowerPoint, however, I used Inkscape to help make changes to the SVG map files whenever the need arose.
4. Surface-level knowledge on how to use a statistical software package
When 2021 arrived, I replaced my old, trusty laptop with a sleeker model that I was sure would last longer in tip-top shape (it did not). I had the data sources, the SVG map files, the PowerPoint know-how, and a new laptop ready for some action. What I did not have was the ability to process large amounts of data in a matter of seconds. Then I decided to take SOC SCI 103.
SOC SCI 103’s full course title is “Statistics for the Social Sciences.” In class, we were taught how to input commands in Stata, “a general-purpose statistical software package developed by StataCorp for data manipulation, visualization, statistics, and automated reporting.” I dreaded the short quizzes we had to answer. My final paper’s regression model definitely could have been better. However, I had so much fun building my own dataset! I also realized that I could apply the commands I was learning in class for the project I had in mind for the 2022 election. Not only did SOC SCI 103 teach me how to build a good dataset and use Stata, it taught me how to organize a dataset in a way that would make it easier to use Stata.
Get Enzo Miguel De Borja’s stories in your inbox
Join Medium for free to get updates from this writer.
Without SOC SCI 103, I don’t think I would have been able to churn out the infogeographics with such speed and confidence in my work.
5. Knowing how to package content and communicate a message
I’ve been a campus journalist since 2016. From 2016 to 2021, I spent almost three non-consecutive years as editor-in-chief of a student publication and around two years performing various roles. Although I never had any professional training, I learned along the way how to write a decent headline, when and when not to publish a piece, and the importance of making outputs as understandable as possible to a broad audience. Most importantly, I learned how to check, double-check, and triple-check the accuracy of whatever I publish (even then, some errors still escape my eye) and cite my sources accordingly.
When I finished crafting my first infogeographic for the 2022 election cycle, I understood that how I decide to package it and communicate its message may matter more than the actual content if it were to gain traction. The final step I take every time before publishing a map is to carefully draft the captions that will explain what the map is about and which angle I want readers to focus on. My experience as a student journalist certainly helped me keep my captions as concise and straightforward as possible (Twitter, after all, could only accommodate 280 characters or so at the time).
That’s pretty much it. These thoughts have been percolating in my mind for quite some time now. I’m happy to have finally written them down.
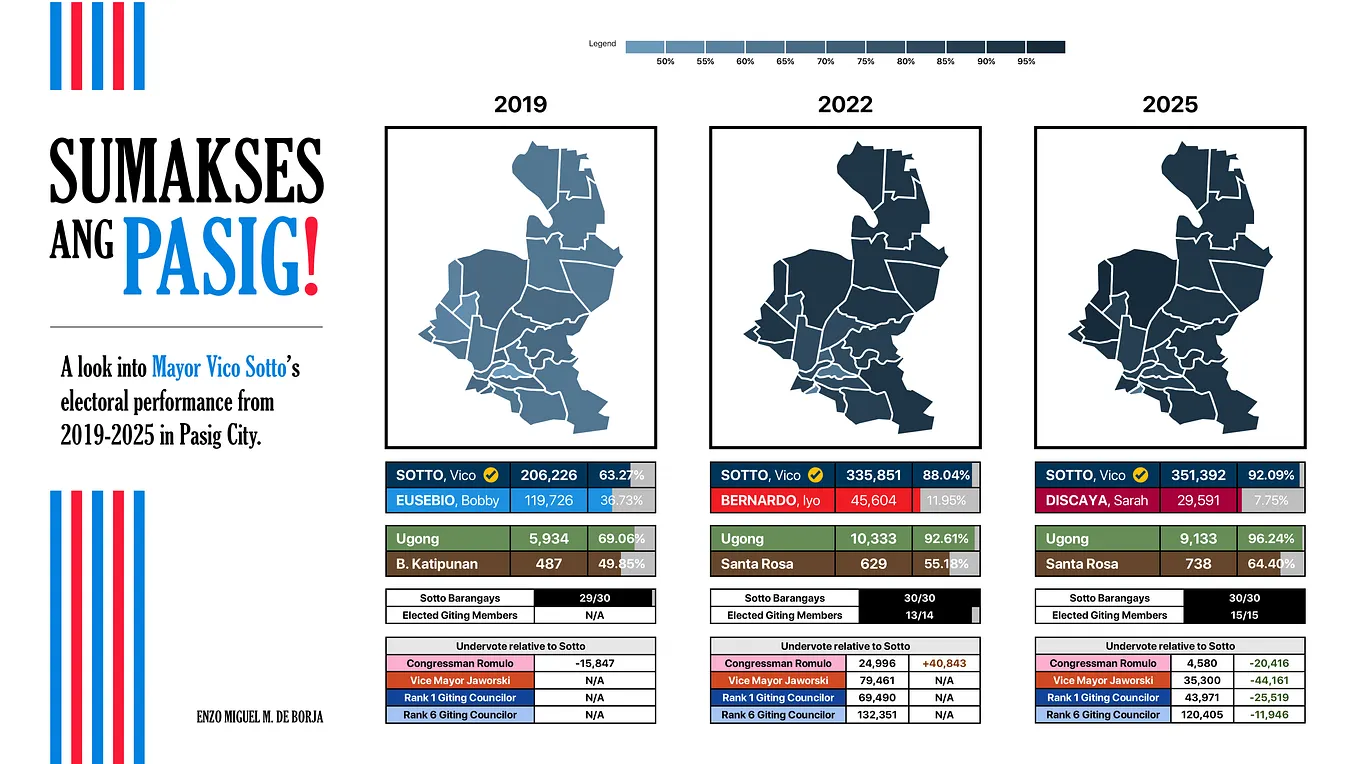
Now, time for my all-time favorite infogeographics from the 2022 presidential election cycle!
1. Travel stats for presidentiables (14 April 2022)

2. Does the “Solid North” exist? (10 February 2022)

3. Battleground CALABARZON (28 April 2022)

4. Cris-crossing Mindanao (18 March 2022) and Barako Batangas (30 April 2022)


5. Keeping up with Leni Robredo (5 May 2022)

6. The Robredo People’s Campaign Map Series (a few weeks after the election)