Decoding the Shadows of the “Wow!” Signal: The Hidden Radio Anomalies of 1977
What nearly 300,000 detector codes reveal about the weaker radio structures of 1977 and the signals an archival search can miss

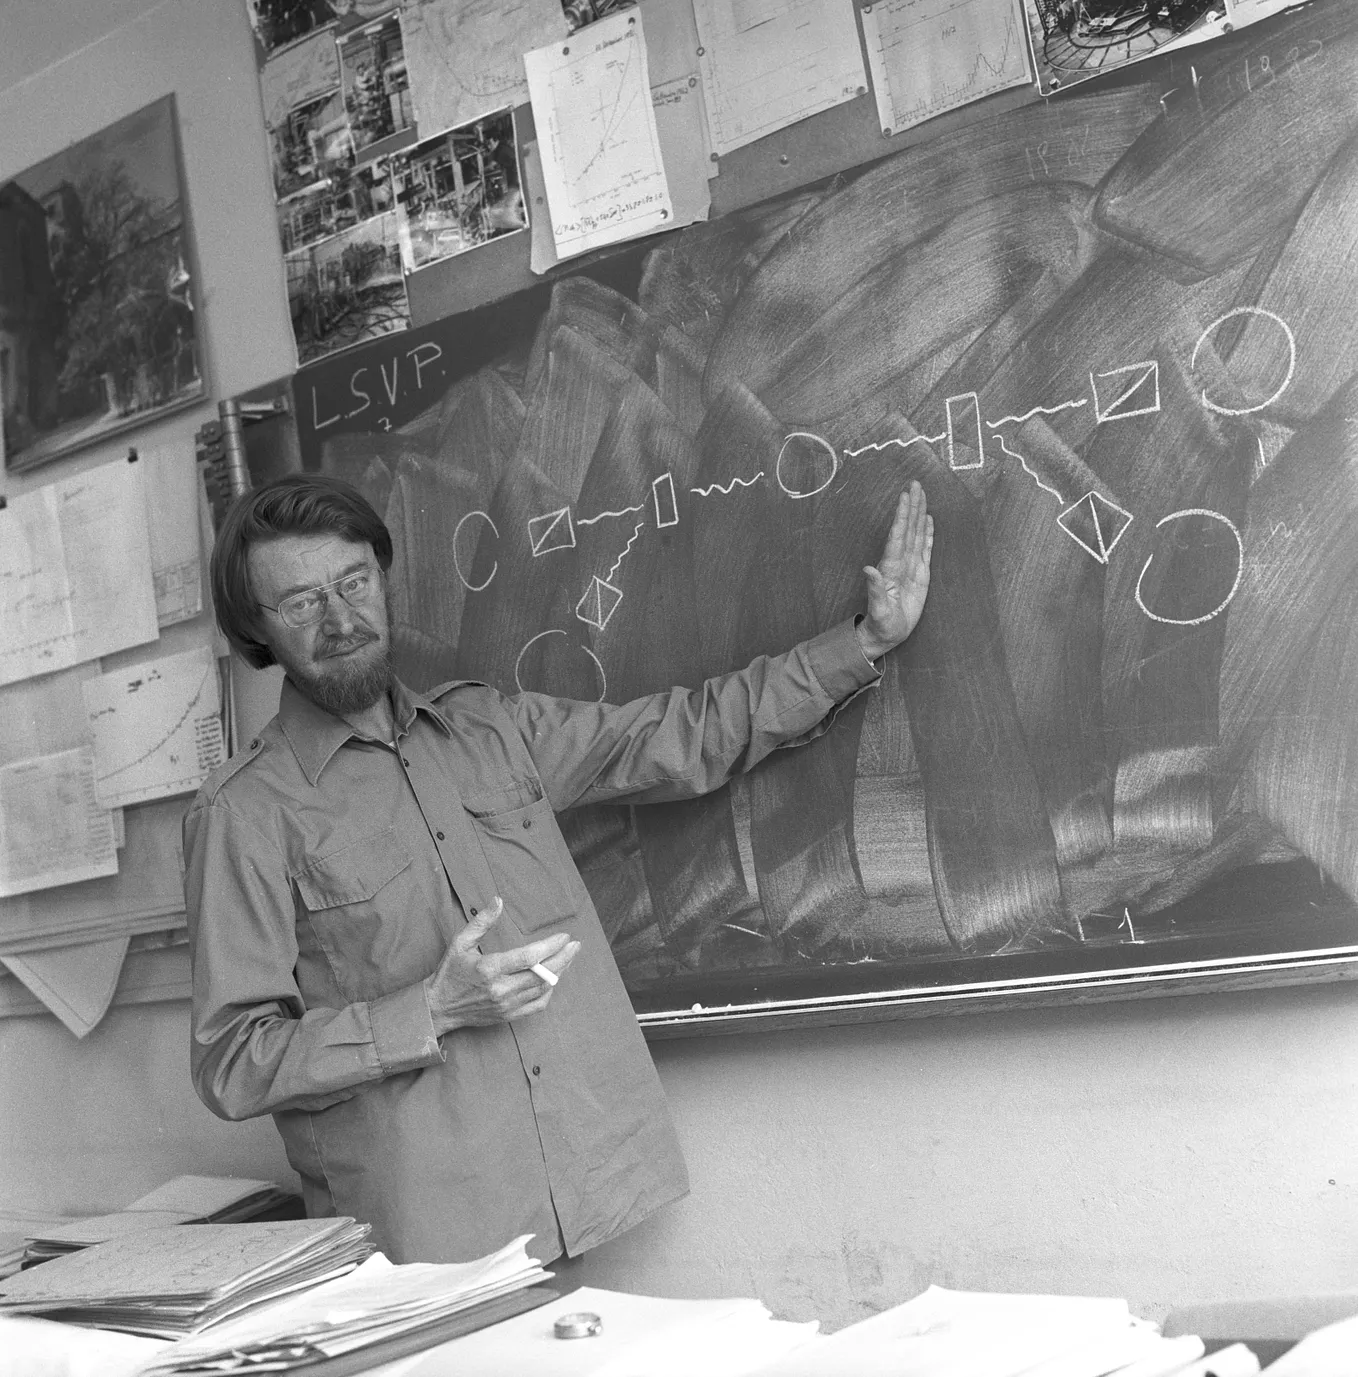
On August 15, 1977, Ohio State University’s Big Ear radio telescope recorded a narrowband signal across six successive readings, covering about 72 seconds. Reviewing the printout, astronomer Jerry Ehman circled the sequence 6EQUJ5 and wrote a single word beside it: Wow!
Nearly half a century later, no recurrence has been confirmed. The familiar image makes the signal look like a lone mountain in an otherwise empty desert.
Looking at the surrounding printouts, I wanted to ask a different question: What if the desert isn’t flat?
I built an audited digital transcription of the complete August 15–16 observing run: 5,974 records and 298,700 printed detector codes. That wider view reveals weaker structures worth comparing across nights. It also exposes how easily a search can miss a signal whose shape differs from the one it expects.
A night larger than six characters
The printouts are a compressed record of what the telescope measured. Each row contains 50 frequency channels. Blanks, digits and letters encode the magnitude of a processed detector statistic. They preserve useful patterns, but they are several steps removed from raw voltages or calibrated radio brightness.
Turning those pages into a usable dataset required computer-assisted character recognition, checks against a separate OCR reading, and visual review of ambiguous cells. I retained links from the digital entries back to their source pages and positions. The complete matrix has not been independently read by hand, so the audit trail matters as much as the transcription.
This work also sits within a longer archival effort. Abel Méndez and colleagues have reanalysed historical Ohio SETI records, and their account of the programme’s later decades describes a much larger population of narrowband events. My contribution is a reproducible comparison within this particular observing run and selected surrounding dates.
The weaker top 25
I ranked structures in the printed data before consulting astronomical catalogues. Wow! occupies rank 1. I held ranks 2 through 26 fixed as a set of 25 weak candidates for the reported follow-up checks.
“Candidate” is a working label here. These are structures selected by an algorithm, not 25 established astronomical sources. Several belong to the same extended complex, and the investigation was exploratory rather than preregistered.
The strongest weak feature appears in channel 12, earlier on the same evening as Wow!. Its most interesting property emerges when I compare it with a selected window from the following night.
Does the pattern follow the sky or the clock
For a telescope watching the sky drift past, a fixed celestial position returns roughly four minutes earlier on the next night. That gives us two alignments to compare: the same printed right ascension, which is a sky coordinate, and the same wall-clock time.
Holding the original channel-12 profile fixed, I obtained a Pearson correlation of r = 0.853 with the next-night window at the same printed right ascension. At the same printed Eastern Standard Time, the correlation was r = −0.458. The first comparison resembles the original rise and fall; the second does not reproduce that positive profile. No time shift was fitted to improve either match.
Two alignments of the same channel-12 feature. The black reference profile is identical in both panels. The next-night data resemble it at the same printed right ascension much more closely than at the same EST. Points include the interpolation used in the paper; detector codes are not physical flux. Correlation measures shape resemblance, not the probability of an astronomical origin. Graphic by the author.

I also checked whether one or two readings were carrying the result. Removing any five consecutive comparison points still left the fixed-coordinate correlation at or above 0.734. A broad structure in channel 20 also resembled its next-night counterpart, with r = 0.794.
Those are useful observations, but the profile is not a unique position marker: a displaced window within the same local complex gives an even stronger channel-12 match. The printed sky coordinate and EST also come from the instrument’s sidereal-clock calculation. A receiver effect tied to sky orientation or frequency tracking could therefore help produce the pattern. Establishing a physical source will require more than this comparison.
Hydrogen gives the patterns context
I next compared the candidates with neutral-hydrogen surveys. Hydrogen emits near 1.420 GHz, the spectral neighbourhood that made the Wow! observation especially interesting to SETI researchers.
Get Maximilian von Liechtenstein’s stories in your inbox
Join Medium for free to get updates from this writer.
Using the LAB survey and the historical frequency convention adopted in the paper, 20 of the 25 candidates sampled substantial hydrogen-line brightness. Specifically, the brightness summed over the two possible horn positions was at least 10 kelvin. The same 20 passed that descriptive criterion in all nine tested pointing scenarios. HI4PI supplied an additional comparison in the broader spectral checks.
This association puts natural Galactic emission into the picture. It does not show that hydrogen caused each printed feature, or explain Wow!. The surveys do not recreate Big Ear’s narrow beam and adaptive processing, and the summed sky brightness is not the difference measured by its two-horn receiver.
Some controls were less favourable, too. When I shifted the candidate channels together through the active band, six alternative assignments scored higher than the original one. Broad hydrogen emission and uncertain receiver response leave several ways to obtain a plausible match. A natural background passing through the old instrument remains an explanation to test.
What a failed search can miss
A separate search covered selected windows on 12 surrounding dates, totalling 3,836 records. I found no verified recurrence of Wow!. These were targeted windows, not twelve complete nights of observations.
To understand that result, I planted simulated profiles into the record representation and asked whether the search recovered them. This is an injection-and-recovery test. The hidden details of the original receiver are unavailable, so the experiment depends on an explicit model of how the printed codes were produced.
In the original seven-date experiment, at simulated peak amplitude 10, the search recovered about 96% of searchable injections placed in one channel. For a profile divided equally between two adjacent channels, recovery fell to 37%. A simultaneous equal split is one test case; it does not represent every kind of frequency drift.
I then ran a separate, paired width test on the five additional dates, with the thresholds unchanged. At the width matched to the search, recovery was 94% for one channel and 47% for an equal split. Shortening the injected pulse reduced those rates to 48% and 2.1%, respectively. These comparisons held simulated peak amplitude fixed; a shorter pulse therefore also carried less total injected signal.

How the search loses sensitivity. Left: the original seven-date experiment at simulated amplitude 10. Right: a separate five-date paired test at the same amplitude, comparing injected Gaussian dispersions of 15.7 and 8 seconds with unchanged search thresholds. All percentages are conditional on searchable placements and the assumed model. They are not calibrated completeness estimates for real radio sources. Graphic by the author.
The low recovery rate does not tell us that the archive contains a hidden population of Wow! repeats. It tells us that this search is much less sensitive to certain modelled profiles. These simulations operate on normalized detector codes, not calibrated fluxes arriving at the telescope. They cannot tell us how faint a real source could have been, or how often one repeated.
A null result becomes more informative when we can say what the search would reliably have found. Here, that answer changes sharply with channel placement and pulse width.
Returning to the instrument
The origin of Wow! remains unresolved. The weaker structures do not solve that mystery, but they give us concrete patterns against which to test explanations of the archive.
I have prepared the transcription, candidate list, analysis code and numerical checks for release with the preprint. The next useful steps are broader blind scans of complete nights and a more faithful reconstruction of Big Ear’s receiver processing, including its filtering, frequency tracking and response to the sky.
Those steps would help distinguish a compact transient from diffuse emission transformed by the instrument, and make future searches easier to interpret.
The famous six characters still deserve our attention. So do the quieter readings around them. Understanding what Big Ear could hear may depend on learning how it recorded both.
Sources and accompanying research
This article draws on my preprint, Weak structure and search sensitivity in the Big Ear Wow! signal archive, version 1.0, and its supporting numerical package.
Jerry R. Ehman, The Big Ear Wow! Signal, 30th Anniversary Report (revised 2010)
Méndez, Dixon and Childers (2026), The Ohio SETI Program — The Last Decades
Kipping and Gray (2022), Could the Wow signal have originated from a stochastic repeating beacon?