The Connection Pool Incident That Took Down Checkout for 14 Minutes
A postmortem on how one innocent HTTP call inside a transaction drained HikariCP and stalled every order.

At 7:42 PM on a Friday, our checkout success rate dropped from 99.6% to 31%.
CPU was fine. Memory was fine. PostgreSQL was bored at 12% utilization. And yet every single checkout request was timing out after 30 seconds.
It took us 14 minutes to recover and three days to fully understand why. This is the postmortem, written the way I wish more postmortems were written: with the embarrassing parts left in.
The setup
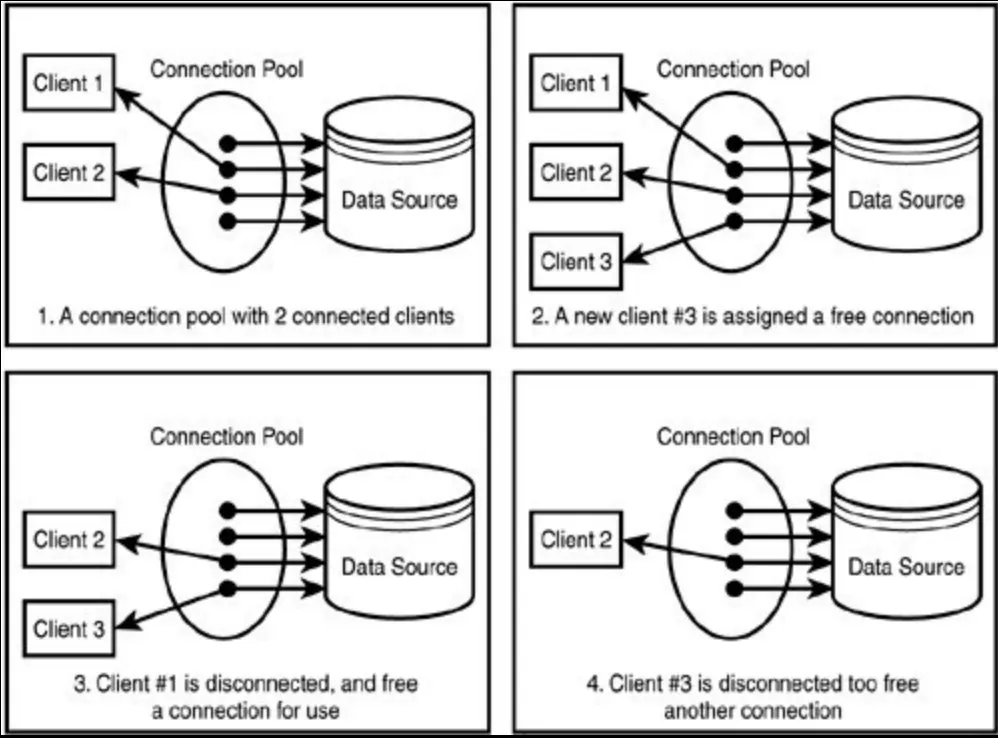
Our checkout service is a Spring Boot 3 application running on 24 Kubernetes pods. Each pod uses HikariCP with a maximum-pool-size of 20 against a PostgreSQL primary.
The flow is simple on paper. Validate the cart, reserve inventory, call the payment provider, write the order, publish an event to Kafka.
Normal traffic is around 400 requests per second. That Friday we had a promotion running and hit about 650.
The timeline
- 19:38 Promotion traffic ramps to 650 rps
- 19:41 Payment provider p99 latency climbs from 180 ms to 2.4 seconds
- 19:42 Checkout success rate falls off a cliff, alerts fire
- 19:44 On-call sees
SQLTransientConnectionExceptionflooding the logs - 19:47 First instinct: restart pods. It helps for about 40 seconds
- 19:51 We notice
hikaricp_connections_pendingsitting at 180+ per pod - 19:53 Feature flag flipped to route payments through the async path
- 19:56 Success rate back above 99%
The error that lied to us
The logs were full of this:
HikariPool-1 - Connection is not available,
request timed out after 30000ms.
(total=20, active=20, idle=0, waiting=187)
Our first reaction was "the database is overloaded." It was not. PostgreSQL showed 480 connections, almost all of them in the state idle in transaction.
That phrase is the whole incident in three words. The connections were not doing work. They were being held open while our code waited on something else.
The root cause
Here is a simplified version of the code that had been running in production for over a year:
@Transactional
public Order checkout(Cart cart) {
    inventoryRepository.reserve(cart.items());

    PaymentResult result = paymentClient.charge(cart.total());

    Order order = orderRepository.save(
        Order.from(cart, result));
    outboxRepository.save(OrderPlaced.of(order));
    return order;
}
See it? The payment call sits inside the @Transactional boundary.
The moment reserve() runs, Hibernate grabs a connection from HikariCP and holds it until the transaction commits. That includes the entire duration of the HTTP call to the payment provider.
When payments took 180 ms, each request held a connection for maybe 250 ms total. With 20 connections per pod, that supports roughly 80 checkouts per second per pod. Plenty of headroom.
When payments took 2.4 seconds, the same pool could serve about 8 checkouts per second per pod. We needed 27.
The math is brutal and it is Little's Law. Concurrency equals throughput times latency. Multiply latency by ten and you need ten times the connections. We did not have them.
Why restarting made it worse
Restarting pods felt like action. It was not.
Each new pod came up with an empty pool, accepted traffic immediately, and drained all 20 connections within seconds. Meanwhile, the restart briefly shifted load onto the remaining pods, which were already starving.
We also had connection-timeout at the default 30 seconds. That meant each waiting thread sat for half a minute before failing. Tomcat's 200 worker threads filled up, and the pod stopped answering even health checks. Kubernetes then marked some pods unready, concentrating traffic further.
Get Naveen Metta’s stories in your inbox
Join Medium for free to get updates from this writer.
A classic cascading failure, triggered by a dependency we did not even own.

What we changed
1. Pulled remote calls out of transactions
This was the real fix. We split the flow into short, focused transactions with the payment call in between.
public Order checkout(Cart cart) {
    Reservation r = inventoryService.reserve(cart); // tx 1
    PaymentResult result = paymentClient.charge(cart.total());
    return orderService.complete(r, result);        // tx 2
}
Yes, this means handling failures between steps. If payment fails, we release the reservation. If the second transaction fails, a reconciliation job picks it up. That complexity was always there. The old code just pretended it was not.
2. Put a circuit breaker and timeout on the payment client
We wrapped the client with Resilience4j. A TimeLimiter at 1.5 seconds and a CircuitBreaker that opens at a 50% failure rate over a 20-call window.
Now when the provider slows down, we fail fast and fall back to the async payment path instead of tying up threads.
3. Tuned HikariCP to fail loudly
spring:
  datasource:
    hikari:
      maximum-pool-size: 20
      connection-timeout: 3000
      leak-detection-threshold: 5000
Notice we did not raise the pool size. Raising it to 60 would have meant 1,440 connections across 24 pods, well past our PostgreSQL max_connections of 1,000. A bigger pool just moves the bottleneck into the database.
Dropping connection-timeout to 3 seconds means we shed load quickly instead of piling up threads. And leak-detection-threshold logs a stack trace whenever a connection is held longer than 5 seconds. That alone would have pointed straight at the payment call months ago.
4. Disabled open-in-view
While we were in there, we found spring.jpa.open-in-view was still enabled. That keeps a connection bound to the request for its whole lifetime. We set it to false and fixed the three lazy-loading exceptions that followed.
5. Added the alerts we should have had
We now alert on three Micrometer metrics:
hikaricp_connections_pendingabove 5 for 1 minutehikaricp_connections_usage_secondsp99 above 1 second- PostgreSQL sessions in
idle in transactionabove 50
The second one is the important one. Connection usage time is the leading indicator. Pending connections is already the symptom.
What we got wrong in the response
Honesty section.
We spent 5 minutes restarting pods before reading the pool stats in the error message, which literally said waiting=187. We had a feature flag for async payments the entire time and nobody on call knew it existed. And our runbook for "checkout down" started with "check database CPU," which sent us in the wrong direction.
The runbook now starts with a single question: is anything holding connections while waiting on a network call?
The bigger lesson
Every @Transactional method is a promise to the database: "I will be quick." Any network call inside that boundary turns the promise into a bet on someone else's latency.
We had a load test. It passed. But it used a mocked payment provider that always answered in 50 ms. Our tests verified the happy path of a dependency we did not control.
Since this incident, we inject latency into dependencies during load tests. If checkout cannot survive a payment provider at 3 seconds, it is not ready for a Friday promotion.
Key takeaways
- Never make HTTP or remote calls inside a
@Transactionalmethod. idle in transactionin PostgreSQL means your app is holding connections hostage.- Bigger pools rarely fix pool exhaustion. They move the problem to the database.
- Set a short
connection-timeoutand enableleak-detection-threshold. - Alert on connection usage time, not just pending connections.
- Load test with slow dependencies, not just fast mocks.
Have you been burned by a connection pool in production? I would love to hear your war story in the comments.