We used Cassandra as for lock management — And It took down our entire app
Background: We run multiple event based apps. Messages come in a queue, application processes these messages and publishes enriched messages to downstream systems via Kafka topic. Sometimes these events fail to publish. A republish job (scheduled cron) was built to republish failed messages every 15 minutes.
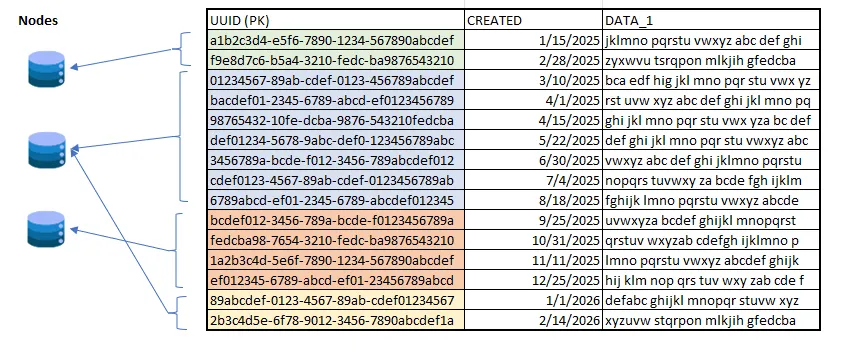
The architecture sounds simple enough. For scalability and resilience, the applications were deployed across four datacenters where each datacenter hosts minimum two pods on Kubernetes cluster. Each pod will communicate to Cassandra nodes sitting in the same datacenter. Cassandra nodes are split evenly across these four datacenters. If pods on all four datacenters run the republish at same time, duplicate events will be published.


We needed a lock mechanism so that only one pod runs the republish scheduler. Applications that use traditional RDBMS uses mechanisms like Schedlock, where a database table acts as a persistent row level lock. Pods (apps) read lock from this table and whoever acquires a lock, runs the scheduler. Other pods skip. We used Cassandra and no relational databases. Developers used the closest offering from Cassandra — Light Weight Transactions (LWT). INSERT..IF NOT EXISTS on a single row using SERIAL consistency. SERIAL consistency was to ensure that only one attempt from any datacenter, wins the lock by requiring agreement from a quorom of nodes present across all the datacenters and not just the local datacenter alone.
In test environments, everything worked fine. In production, it took the entire app down, until we restarted it.
What we saw first
Symptoms show a series of NodeUnavailableException and NoNodeAvailableException. These names indicated cluster level issue and not application related. Nodes and cluster health came healthy on inspection. We didn’t pinpoint these exceptions to any particular volume of transaction or the republish scheduler jobs that ran every fifteen minutes. Until we were able to reproduce the same issue in our performance environment where the deployment topology is similar to production environment. We had also exposed Cassandra driver metrics from the spring boot application and plotted them on Grafana for triaging. The plots clearly showed the pattern. The connection to the Cassandra nodes were dropped eventually, but whenever the scheduler tries to attain lock. So we analysed more about the locking mechanism which is in use.
Why “locks” are expensive in Cassandra?
A normal Cassandra write is cheap as Cassandra doesn’t make replicas agree on anything. It just writes to however many replicas your consistency level asks for and moves on. This is the whole basis of its speed.
An LWT breaks this. IF NOT EXISTS, need to check a condition first and then write atomically, with a guarantee that no other writes can sneak in and overwrite. That requires not just a write, instead, all the nodes must reach an agreement. This is achieved using a consensus protocol — Paxos.
You really don’t need to understand Paxos in detail to understand the point here. In order for multiple machines to reach an agreement, it will take back-and-forth messages and not just a single message. Cassandra’s LWT implementation requires four separate round trips across the network between coordinator nodes and replicas before it completes. A normal write just takes a single round trip to complete. The LWT round trips can cross datacenter boundaries based on the serial consistency level used. This is the tax that we pay for using an LWT at all.
Issue #1: SERIAL serial LWT Consistency — 7 nodes across 4 Datacenters
SERIAL consistency level means paxos round trips needed a quorum across every replica in every datacenter, not just local datacenter. With a replication factor of 3 across 4 datacenters, that is 12 replicas in total. Majority of 12 is 7. Every single LWT required 7 out of 12 nodes, spread across 4 datacenters to agree upon, across 4 sequential round trips, before one cluster even found out that it has won.
Issue #2: Thundering Herd
All four clusters ran on the same schedule. All four datacenters fired the cron at the exact moment and tried to acquire the exact lock. The thundering herd is a classic problem in such scenarios. An analogy would be like, 4 people trying to swipe the same key card through the same door lock, but the door doesn’t accept one of the swipes and reject the other 3 immediately. Instead, it takes time to sort out who goes first and while thats being sorted, everyone is standing still blocking the doorway. Now, do that with a protocol that slows down under contention, and repeat that every 15 minutes.
Why the pool didn’t recover on it’s own?
Get Neeraj Prakash’s stories in your inbox
Join Medium for free to get updates from this writer.
Though we could observe connection pool thread contention that eventually causes dropped connectivity to nodes, we were wondering why the connection pool doesnt recover. Our app did have a request timeout that was configured to well below 15 minutes and the natural assumption was that even under heavy contention, the request that was blocked would timeout, free up the thread and should recover before the next cron. But it was obvious from the Grafana metrics that this was not happening. The connection to the node was never recovered until we restarted the pod.
The reason comes down to how the Cassandra driver (DataStax) identifies and handles in-flight requests. Every request sent over a connection gets tagged with a stream id, so responses can be matched back to the request that sent them. As per DataStax docs, when a client-side timeout fires, the driver writes to a node but stops waiting for the response — but it can’t safely reuse that stream id on the connection until it knows for sure the server is done with it. Refer to the DataStax driver docs in references section below.
In other words, the timeout tells the client to stop waiting for the response. It does not tell Cassandra to stop working on the request. And it neither frees up the connection slot the request was using. If the actual response comes back later, the slot stays reserved until it arrives. This is the case when 4 clusters are fighting it out over the same row lock over the Paxos.
We reproduced this in our performance environment to see exactly how it happened, and it wasn’t a slow leak across cron cycles at all — the connection pool dropped from full capacity to zero the moment a single cron fired, with all 8 pods (2 per datacenter × 4 datacenters) hitting the same lock row at the same instant.
Our best explanation for why it collapsed that fast, rather than draining gradually, comes down to how the DataStax driver actually tracks pool capacity: the metric we were watching in Grafana (pool.available-streams) isn't a count of 1024 individual requests slowly piling up — it's a per-node metric computed from the connections currently open to that node. The driver also runs a periodic heartbeat to check that a connection is still alive; if a connection goes unresponsive for too long, the driver trashes it and opens a replacement. Under 8-way Paxos contention, the coordinator node can get so consumed by the negotiation trips that it stops responding promptly to anything on that connection — including the heartbeat. When the heartbeat fails, the connection gets trashed, and available-streams for that node drops to 0 in a single step, not a gradual decline — which is exactly the cliff we saw on the graph, and exactly why it read as the node being "unreachable", until a new connection is successfully reopened, the driver has nowhere to route a request to that node at all.

NodeUnavailableException seems like the node was down. This class of the driver exception is actually the driver’s own connection pool telling you that it has nothing left to send a requets on, a local, client-side exhaustion - not a report of the cluster’s actual health.
Because nothing frees up the slots except the original request finally completing, the pool doesn’t recover until something forces it.
The fix:
Two changes were made to stop the 4 clusters colliding on the same row at the same instant:
- Staggered the cron expression- Stagger cron expression 15 minutes apart the cluster. So only one cluster ever attempts lock at a time. No more herd, or pile of contending requests leaking connection slots.
- Switched SERIAL to LOCAL_SERIAL — scoping Paxos agreement to local datacenter instead of all four. Fewer nodes to agree with, no cross-DC round trips, faster resolution even under contention.
Actual lesson learnt:
Cassandra is built to prioritize availability and LWT is a narrow escape hatch that it offers when you need something close to stronger consistency. Reaching for that hatch to build a lock means every acquisition pays the full price of distributed consensus. A purpose-built coordination system such as Zookeeper, etcd, Redis based lock are designed around that exact pattern. But, Cassandra isn’t. Don’t build a lock around it.
References:
https://docs.datastax.com/en/developer/java-driver/4.4/manual/core/speculative_execution/index.html