Should You Wait Until Spring to Sell? In This Market, the Math Is Turning Against It

Spring is often the best season to sell in the Seattle area (King, Snohomish and Pierce counties), but not always. And almost certainly, not this year. Over the past ten years, a home that went under contract in March sold for about 5.6% more, on average, than the same home in November. But that lift only pays off if prices don’t fall faster than it while you wait. Right now they are falling faster each month. Beneath the normal seasonal dip, contract prices fell 1.0% in October, their fastest drop since prices peaked in May. At October’s pace, waiting until March already comes out slightly behind after holding costs. If the slide keeps speeding up, waiting costs about 3%. And history is clear about winters like this one: since 1990, every time underlying prices fell more than 2% over the winter, waiting for spring lost money after holding costs.
Seller decision study: King, Snohomish and Pierce counties. NWMLS sales via InfoSparks (2016 to October 2026), contract-date prices from our fall 2026 analysis, and the Case-Shiller Seattle index (1990 to 2026).
At a glance
- +4.6% to +6.2% Normal spring lift, 2016–2025: the same home under contract in March vs November
- −1.0% October’s underlying change in contract prices, the fastest since May
- −20% Pending sales in September 2026 vs September 2025, three counties combined
- 6 of 6 Winters since 1990 with an underlying drop over 2% in which waiting for spring lost money after holding costs

Contract price for comparable homes plus the normal spring lift, minus holding costs of 0.4% of the home’s value a month.
Typical Spring Pattern (When It CAN Payoff)
The seasonal pattern is real and reliable. In King County, homes that closed in the best spring month sold closer to their original asking price than September closings in every year since 2016. From 2023 to 2026, March to May closings averaged 100.0% to 100.6% of original asking. September closings averaged 97.6% and December closings 96.7%.

By closing month. A home that closes in a given month usually went on the market about five weeks earlier.
Spring has also moved earlier. Before 2020, King County sales averaged above original asking from February through August closings. Since 2023, only March to May closings do, which means homes listed from about late February to April. Buyers show up first: from 2023 to 2026, each King County listing got 23% to 29% more showings than normal from January to March. New listings peaked in May, 45% above normal, when showings per listing were back to average.
But ONLY If Prices Hold Steady
The spring lift changes only slowly from one year to the next. What changes from year to year is how much the market falls underneath it. Since 1990, a seller who waited from October to the next April got a lower same-home price in 8 of 36 years: 1990, 1994, every year from 2007 to 2011, and 2022. Nearly all were falling markets; 2011 was the bottom of the last crash.

Waiting Until Spring Is Often Wrong
Across all 36 winters since 1990, waiting from October to April lost money in 22% of years, and in 39% once four months of holding costs are counted. In a falling market, the odds turn against it. In the 10 winters when underlying prices fell, waiting lost money in 7 (70%), and in 8 (80%) after holding costs. In the 6 winters when they fell more than 2% (1990, 2007, 2008, 2010, 2022 and 2025), waiting lost money after holding costs every time.

At October’s contract pace, the underlying drop from November to March would be about 4.1%, which puts this winter in the last group.
The Worst Years
The worst losses came when the decline was speeding up:

Same-home price, October closings to the next April’s (Case-Shiller Seattle). Holding costs: four months at 0.4% of the home’s value a month.
Get Seller Paths’s stories in your inbox
Join Medium for free to get updates from this writer.
On an $850,000 home, waiting through the winter of 2008–09 cost about $119,000. Before 2013 this measure showed little or no spring lift, which is why even the mild decline of 2009–10 cost sellers who waited. In 2022–23 the lift was back to its current size, and an underlying drop of 3.7% still used up all of it.
Last Year
Sellers who waited from fall 2025 to spring 2026 got a small gain on paper and nothing after costs. Same-home prices rose 1.3% from October 2025 to April 2026, while the underlying trend fell 2.0%, about 0.3% a month. Four months of holding costs, about 1.6%, more than used up the gain.
Spring 2026 also came up short in King County. The best month, March, averaged 99.2% of original asking, against 97.2% the previous October, and never reached asking. Same-home prices peaked with May closings and fell 2.0% by August.
Last winter’s underlying decline was about 0.3% a month. October’s contract pace was about three times that.
This Decline Is Speeding Up
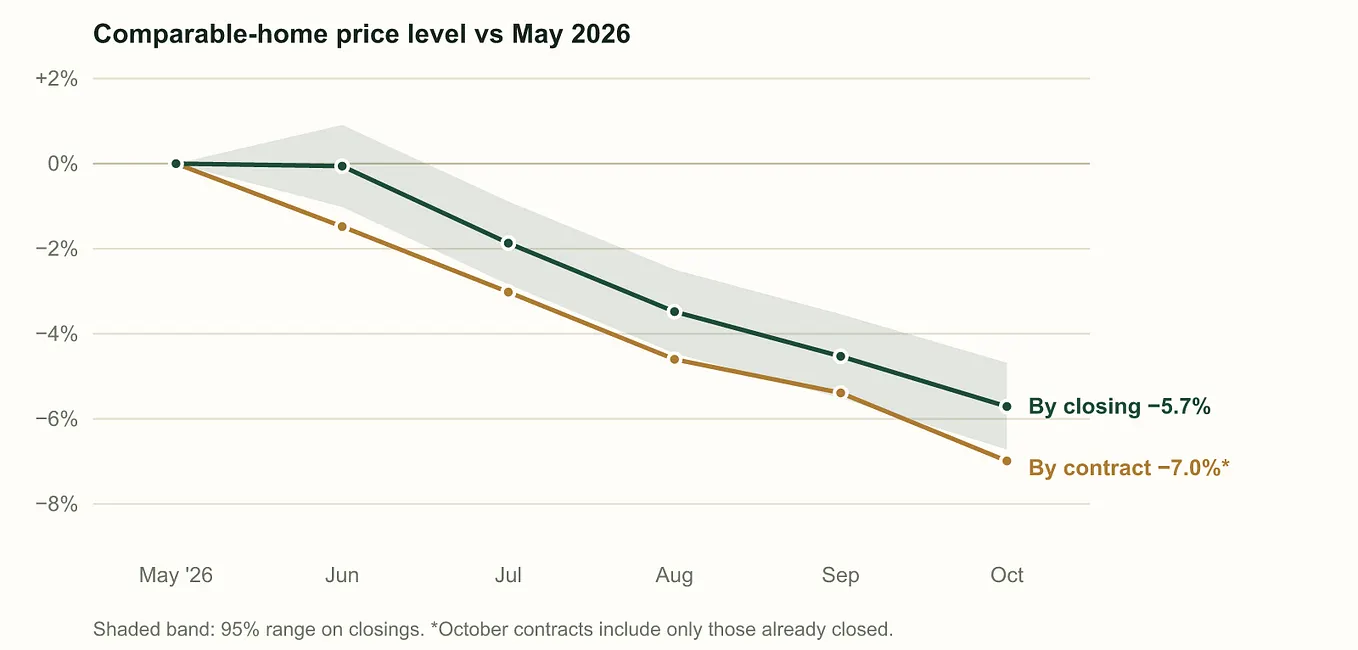
Contract prices lead closing prices by a month or more, so they show where the market is going. Our fall analysis tracks prices for comparable homes by the date each home went under contract. They fell every month from May to October. Part of each drop is the normal fall slowdown. Taking that out leaves the underlying change:

September’s drop was about the normal amount for the month. October’s was more than twice normal, at a time of year when the seasonal pull is easing. October counts only the contracts that have closed so far, so it will be revised. But the other measures point the same way.

Pending sales held near 2025’s level through June, then fell 14% in July, 15% in August, 20% in September and 13% in October. Active listings were up 24% from a year earlier in October. King County’s months of supply rose from 2.2 in January to 4.8 in September, and NWMLS inventory reached its highest level since 2014.
What Waiting Until March Is Worth Now
A seller listing now would typically go under contract in November. One who waits would go under contract in March. Over those four months, the normal spring lift has averaged about 5.6% over the past ten years (2016–2025). Against it are the market’s underlying decline and the cost of holding the home, about 0.4% of its value a month for a typical owner with a mortgage.

Waiting breaks even at an underlying decline of about 0.95% a month, a pace October’s contracts have already passed. On an $850,000 home, King County’s median, waiting loses about $2,500 at October’s pace and about $24,000 if the slide keeps speeding up. Coming out ahead needs the decline to slow down. Contracts are moving the other way, and a faster slide, like 2008’s, would cost far more than the worst case here.
If You’re Deciding Now
- Price from today’s market, not last spring’s. A spring 2026 comparable sale reads about 6% high against today.
- If you can sell now, the numbers favor it. Waiting has a small upside that depends on the market calming down, and a larger downside if it keeps going the way contracts show.
- If you do wait, don’t wait for May. The spring window now opens in late February. A May listing meets the year’s biggest wave of new listings and usually closes after the above-asking window has passed. Do repairs and photos in December/January.
- Compare every path. A cash or development offer can lock in today’s price instead of betting on next spring’s. How Seller Paths compares them.
Waiting for spring prices to come back is a risky bet in a market that is falling faster each month. Contact Seller Paths for a current valuation and a side-by-side look at what a cash offer, a development offer and an Elevated Listing would each net on your property, now and in the spring.
How We Measured
Contract prices. These come from our fall 2026 analysis, a quality-adjusted price index built from a regression on 11,733 NWMLS closings of detached homes that measures what the same home in the same ZIP code sold for, by the month it went under contract. The normal seasonal pattern for contracts comes from the S&P CoreLogic Case-Shiller WA-Seattle index, not seasonally adjusted compared with seasonally adjusted ( FRED SEXRNSA and SEXRSA), averaged over the ten years 2016–2025. In each of those years the lift from a November contract to a March contract was between 4.6% and 6.2%; the scenarios use the 5.6% average. It is shifted two months earlier, because the index averages three months of closings and closings follow contracts by about a month. The underlying change is the observed change minus that normal seasonal change.
Scenarios. Each scenario runs four months, from a November contract to a March contract. “Keeps speeding up” assumes the underlying decline keeps getting faster by about 0.25 points a month, the rate at which it sped up from June to October. Holding costs of 0.4% a month cover mortgage interest, property tax, insurance and upkeep for a typical owner with a mortgage; an owner without one pays less, which moves the break-even point to a faster decline.
Seasonality and market measures. These use NWMLS residential and condo sales for King, Snohomish and Pierce counties, monthly from January 2016 to October 2026, from InfoSparks (ShowingTime). “Share of original list price” is the average sale price as a percentage of the first asking price. “Normal” for a month is its value divided by the average of the 12 months around it. Showings per listing come from ShowingTime appointment records. The 2016–19 and 2023–26 averages leave out 2020 to 2022, when pandemic bidding wars and then the 2022 rate shock distorted the usual pattern. The fall-to-spring history (the “same-home” figures) uses Case-Shiller, a repeat-sales index that compares sales of the same homes, with its not-seasonally-adjusted October and April values for each year since 1990.
Originally published at https://sellerpaths.com on November 4, 2026.