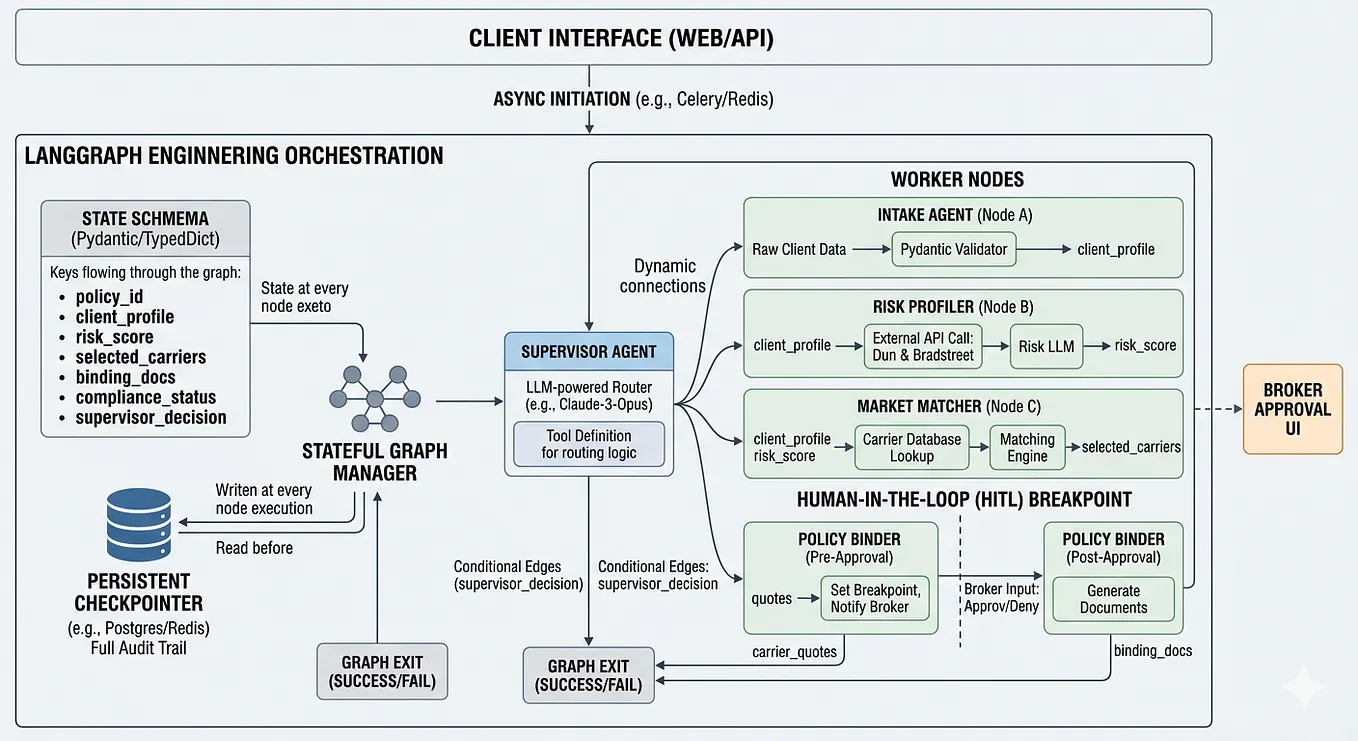
The Risk Graph: The Intelligence Layer Commercial Insurance Has Been Missing. Here is an uncomfortable truth about commercial insurance: we have more data than ever, and less insight than we need.
A large commercial client may have dozens of subsidiaries, hundreds of assets, thousands of locations, and years of claims history. That information exists somewhere — buried in CRM records, policy schedules, statements of values, loss runs, binders, claims notes, billing systems, D&B feeds, and dozens of PDFs that no one has fully read. The data is there. The intelligence is not.
The result is a problem every insurer and broker knows but rarely names directly: our systems were built to administer contracts. They were never designed to understand risk.
A broker may know the client. A policy system may know the contract. A claims system may know the loss. A billing system may know the money. A hazard vendor may know the location. A document may know the details. But no single system knows the full risk picture.
That gap is where competitive advantage will be built or lost in the next decade. And closing it requires a fundamentally different kind of architecture — one built around relationships and reasoning, not just records and retrieval.
That architecture is the risk graph.
What a risk graph actually is
A risk graph is a knowledge graph purpose-built for commercial insurance. It connects organizations, subsidiaries, contacts, assets, locations, exposures, hazards, controls, policies, claims, payments, and regulatory evidence into a single relationship-driven intelligence layer.
It does not replace CRM, policy administration, claims systems, or the data warehouse. It becomes the connective tissue between them — the layer that knows not just what each system holds, but how all the pieces relate to each other.
The question it is designed to answer is deceptively simple:
What is this organization exposed to, what protects it, what has happened before, and what evidence supports that conclusion?
That question, asked consistently and answered reliably, is worth an enormous amount. It is the difference between a broker who presents a submission and one who presents a risk story. Between an underwriter who reviews a document and one who understands an exposure. Between a claims team that processes a loss and one that connects it back to a pattern.
Why now? Because the data problems have compounded
Commercial insurance has always had fragmented data. What has changed is the cost of that fragmentation.
AI has raised the stakes. A language model can summarize documents, draft submissions, and answer questions — but its output is only as reliable as the data it reasons over. If the underlying facts are scattered, duplicated, inconsistent, or ungoverned, the AI will confidently assemble an answer built on bad foundations. The industry has seen enough AI pilots fail not because the models were wrong, but because the data wasn’t ready.
At the same time, client complexity has increased. Corporate structures are more intricate. Risk programs span multiple carriers, jurisdictions, and policy structures. Regulatory demands on evidence and explainability are rising. The margin for error in knowing what is covered, what is exposed, and what has happened is shrinking.
And the competitive pressure is real. Firms that can answer complex exposure questions in minutes rather than days will win the advisory relationship. Those that cannot will be commoditized.
The design principle that changes everything: entity first, policy second
Most insurance platforms are built around policies. That is not wrong — policies are contracts, and contracts drive billing, compliance, renewals, and claims. But policy-centricity is a trap when you are trying to understand risk.
A building has flood exposure whether or not the policy covers flood. A data center has cyber exposure whether or not the cyber limit is adequate. A subsidiary creates liability whether or not it was correctly added to the program. A critical supplier creates business interruption exposure whether or not anyone modeled it.
Risk exists independent of the contract that partially addresses it.
This is why the risk graph must be entity and asset first. Policies should be modeled as mitigation instruments attached to exposures — not as the center of the data model. This single architectural decision shifts the entire platform from contract administration to risk intelligence. It makes previously invisible questions visible: What risks exist? Which are insured? Which are underinsured? Which subsidiaries are missing? Where are the gaps between what the client owns and what the policy actually covers?
That is not a reporting feature. That is a fundamentally different way of knowing.
The risk object: the atomic unit of connected intelligence

In this architecture, every meaningful entity is a risk object. Organizations, subsidiaries, properties, vehicles, data centers, cyber assets, contractual liabilities, business interruption dependencies, hazard zones, policies, claims, payments, regulatory evidence — each is a typed node in the graph, connected by the relationships that give it meaning.
But a risk object is more than a record. Every node carries a metadata envelope that tracks identity, lineage, confidence, quality, temporal validity, and security classification:
json
{
  "risk_object_id": "RO-123456",
  "risk_object_type": "PROPERTY",
  "name": "Fremont Manufacturing Facility",
  "confidence_score": 0.94,
  "data_quality_score": 0.88,
  "last_verified_date": "2026-05-20",
  "sensitivity": "CONFIDENTIAL",
  "lineage": {
    "created_by": "hazard_enrichment_pipeline",
    "created_at": "2026-06-05T10:00:00Z"
  }
}
This matters because a risk graph that connects data without tracking provenance is just a faster way to spread incorrect information. Confidence scoring, lineage, and quality controls are not operational overhead. They are what makes the intelligence trustworthy — and trustworthy intelligence is the only kind that is actually useful.
The enterprise architecture

A risk graph is not a graph database with an insurance schema. It is an enterprise data product, and the graph layer is only one part of a larger platform.
The full architecture has five layers. Source systems provide the raw material: CRM, placement, policy administration, claims, billing, documents, email, and third-party data. The ingestion layer transforms this raw material into the graph using change data capture, APIs, batch processes, event streams, and document AI. The processing and enrichment layer adds entity resolution, asset resolution, geocoding, hazard context, data quality checks, and canonical mapping. The risk data platform layer holds the lakehouse for history, the risk graph for relationships, the search index for discovery, the vector index for semantic retrieval, and the governance catalog for lineage and stewardship. The serving and intelligence layer exposes risk APIs, GraphQL, rules engines, scoring models, graph-grounded AI, and dashboards to the teams that need them.
The technology matters less than the discipline. A well-governed risk graph running on modest infrastructure will outperform an ungoverned one running on enterprise-grade tooling every time.
Getting the data in: ingestion is harder than it looks

Insurance data does not live in one place, and it does not move in one way. A mature ingestion strategy needs at least four patterns working simultaneously.
Change data capture keeps the graph current without batch lag. Policy changes, claim status updates, reserve changes, and CRM hierarchy changes can happen throughout the day. CDC captures those changes at the database level and propagates them to the graph in near real-time.
API integration connects SaaS platforms, enrichment vendors, hazard data providers, cyber rating services, and partner systems. Each external source speaks its own language; the ingestion layer translates into the canonical graph model.
Document AI is unavoidable. Commercial insurance still runs on PDFs, spreadsheets, binders, loss runs, and engineering reports. The key design choice is confidence-gating: high-confidence extractions flow automatically; low-confidence extractions route to human review. The graph should know the difference between a fact and a guess.
Third-party enrichment is what transforms an internal record into a risk intelligence record. Firmographics, corporate linkage, hazard scores, property attributes, cyber posture, climate data — these are the layers that make a property address into an underwritable risk.
The internal and external data converge in the graph. That convergence is where the real value lives.
The AI question: grounded reasoning, not chat

The commercial insurance industry has spent the last two years asking the wrong AI question. The question has been: how do we build better document summarization? The right question is: how do we build AI that reasons over a governed model of risk?
The distinction is not subtle. A generic AI assistant can summarize a loss run. A graph-grounded AI assistant can answer: Why is this account high risk, and what specific evidence — across assets, claims history, hazard exposure, and coverage gaps — supports that conclusion?
The difference is the grounding layer. A graph-grounded AI pipeline routes every question through intent classification, then retrieves relevant graph facts, source documents, policy data, and claims records, filters by permission, assembles evidence, and generates a response that is traceable to verified data. The AI is not guessing. It is reasoning.
This matters enormously for regulated industries. An underwriter who acts on an AI recommendation needs to know where it came from. A broker who presents a risk summary to a client needs to defend it. A compliance team that produces a regulatory evidence package needs a chain of custody. A risk graph provides all three.
The questions this platform enables are qualitatively different from what document search can answer:
Show all assets owned by ABC Manufacturing and its subsidiaries in high earthquake zones with replacement values above $25 million and earthquake limits below replacement value. That question crosses entity hierarchy, subsidiary relationships, property schedules, geocoding, hazard data, asset values, policy limits, and sublimit structures simultaneously. In most organizations today, answering it takes analysts, spreadsheets, and days. In a mature risk graph, it is a query.
Why is this account considered high risk, and what evidence supports that conclusion? The answer comes from graph facts, document lineage, and confidence scores — not from a language model’s approximation of what might be true.
Architecture choices that define the platform
Three architectural decisions deserve careful thinking before the first line of code is written.
The first is property graph versus semantic graph. Property graphs are better for operational use cases: broker workflows, claims investigation, relationship traversal, and the kind of account-360 visibility teams need daily. Semantic graphs are better for ontological rigor, regulatory inference, and cross-system interoperability. A Tier 1 broker likely needs both — a property graph for operational intelligence and a semantic ontology layer for governance and regulatory meaning.
Get Subash Mandanapu’s stories in your inbox
Join Medium for free to get updates from this writer.
The second is system of record versus system of intelligence. The graph should almost never try to be the system of record. CRM owns accounts. Policy administration owns policies. Claims owns loss transactions. Billing owns payments. The risk graph owns the relationships, the context, and the connected decisioning layer above them all. Fighting this boundary wastes years of effort.
The third is governed APIs over raw graph queries. Do not expose Cypher, Gremlin, or SPARQL directly to business applications. Create purpose-built APIs — entity risk profile, subsidiary lookup, asset exposure summary, coverage gap detection, intake prefill, regulatory evidence package — that encode the access model and business logic. This is how the graph becomes a platform rather than a database.
Who uses it and how
The graph reveals its value differently depending on where in the organization it lands.
Intake teams use it to match incoming clients against known entities, prefill asset and location data, surface enrichment gaps before the submission goes out, and generate broker-ready packages rather than manual questionnaires.
Brokers use it to see the full account picture in one place: entity hierarchy, asset map, exposure summary, policy view, coverage gaps, and claims history. More importantly, they use it to move from placement to advisory — from recommending coverage to explaining risk.
Underwriters use it to validate submission quality, understand aggregate hazard exposure, check appetite alignment, and review loss history in context. The graph turns a document review into a structured risk assessment.
Claims teams use it to connect a new claim to its policy, asset, location, cause of loss, and historical pattern. What used to require cross-system lookups becomes a single connected view.
Compliance and regulatory teams use it to assemble evidence packages with lineage — policy history, claims records, payments, source documents — in a form that is auditable and explainable.
Governance: the part most teams underestimate
A risk graph connects sensitive client, policy, claim, financial, and personal data across the enterprise. Governance is not a feature to add later. It is a design constraint from day one.
The platform needs data ownership by domain, source-system lineage, confidence scores, temporal versioning, human approval workflows, role-based and attribute-based access, PII classification, financial data controls, audit logging, explainable scoring, AI model governance, and client confidentiality rules.
The access model should be purpose-based. Intake analysts see limited financial data and create draft risk objects. Brokers see their assigned accounts in full. Underwriters see submission packages and exposure details. Claims adjusters see claim-linked policies and payment records. Compliance sees approved evidence packages. Executives see portfolio analytics. Data stewards resolve duplicates and approve golden records.
The graph should know not only what is true. It should know who is allowed to see it.
A poorly governed risk graph does not just fail to deliver value. It becomes a liability.
Where the market is already moving
This is not a speculative architecture. The signals are visible now.
Convr has publicly described organizing commercial underwriting information — documents, extractions, and public data — into a graph database using a commercial P&C ontology. Dun & Bradstreet’s corporate linkage capabilities have become foundational for understanding complex client structures and are embedded in most sophisticated broker workflows. Moody’s Location Intelligence API provides location-level hazard, exposure, risk scoring, and loss-cost data that enriches underwriting at the asset level. Neo4j’s insurance use cases — including Zurich’s publicly described fraud triage system using graph data at millions of nodes — show that graph architectures in insurance are operational, not theoretical. Verisk’s catastrophe modeling products have demonstrated for years that data-driven, connected risk modeling outperforms document-based workflows.
None of these examples is identical to the full enterprise risk graph described here. But they all point in the same direction: the market is moving from siloed, document-heavy workflows toward connected, enriched, explainable risk intelligence. The question is not whether this transition will happen. It is who will lead it and who will follow.
The maturity journey: four phases to AI-native

The risk graph does not have to be built all at once. It matures in phases, each of which delivers standalone business value.
Phase 1 — Connected Data. Connect CRM, entity hierarchy, contacts, policies, claims, and locations. The payoff is account 360, cleaner client hierarchy, less manual reconciliation, and a foundation to build on. Most organizations can reach this milestone in 90 days with the right focus.
Phase 2 — Enriched Risk Objects. Add third-party firmographics, geocoding, hazard layers, property attributes, cyber ratings, climate scores, and document extraction. The payoff is better exposure quality, better submissions, coverage gap detection, and the beginning of genuine risk advisory capability.
Phase 3 — Decision Intelligence. Add scoring, recommendations, appetite matching, and workflow triggers. The payoff is automated coverage gap recommendations, underwriting appetite alignment, claims pattern detection, and portfolio accumulation views that actually reflect the book.
Phase 4 — AI-Native Platform. Connect the graph to AI assistants, retrieval pipelines, reasoning workflows, and evidence generation. The payoff is broker copilots, underwriting copilots, claims copilots, and regulatory evidence workflows where the AI can actually be trusted because every response is grounded in governed facts.
The real moat: compounding risk memory
Here is the strategic point that deserves to land clearly.
The moat is not the graph database. Any competitor can buy a graph database.
The moat is the proprietary risk memory that compounds over time. Every renewal enriches it. Every claim deepens it. Every submission refines it. Every enrichment strengthens it. Every broker correction improves it. Every underwriting decision teaches it.
A mature risk graph accumulates entity hierarchies, subsidiary relationships, historical submissions, asset schedules, policy structures, coverage decisions, claims outcomes, loss history, hazard enrichment, broker notes, underwriter feedback, carrier appetite signals, regulatory evidence, data steward corrections, and AI interaction feedback. It becomes a living institutional memory of commercial risk — one that no competitor can replicate simply by buying better software.
This creates five compounding moats. A data moat because the firm owns a cleaner, richer, more connected version of commercial risk than any single source system holds. A workflow moat because the graph becomes embedded in intake, placement, underwriting, claims, compliance, and advisory. An AI moat because the graph is the governed grounding layer that makes AI trustworthy. An advisory moat because brokers can move from transactional placement to proactive risk intelligence. A market moat because the firm learns which carriers have appetite for which risks based on actual submission, quote, declination, and outcome history.
The graph becomes a compounding intelligence asset. The longer it runs, the harder it is to replicate, and the more valuable it becomes.
A practical roadmap
First 90 days. Build the foundation: canonical risk object model, entity master, asset master, CRM ingestion, policy ingestion, claims ingestion, D&B-style enrichment, basic graph layer, account 360 view, source lineage, and confidence scoring. Prove the value on a focused use case — property risk or account 360 — before expanding.
Months 3–6. Add enrichment and document intelligence: geocoding, hazard layers, statement of values ingestion, loss run extraction, broker intake prefill, property exposure view, and coverage gap detection. This is where the graph starts changing daily workflows.
Months 6–12. Add intelligence: risk scoring, underwriting appetite matching, claims pattern analysis, portfolio accumulation dashboards, and a graph-grounded AI assistant. This is where the platform starts compounding.
After 12 months. Scale into enterprise intelligence: multi-line ontology, global regulatory model, client-facing risk portal, real-time exposure monitoring, carrier appetite graph, graph ML models, and AI-native risk advisory workflows. This is where the moat becomes visible.
The firms that understand risk will win
The next generation of commercial insurance platforms will not be defined by who has the most systems. They will be defined by who has the most connected understanding of risk.
CRM knows the client. Policy systems know the contract. Claims systems know the loss. Billing systems know the money. Hazard vendors know the location. Documents know the details. Brokers know the story.
The risk graph connects all of it into something none of those systems can be alone: a living map of risk that knows who owns what, where it sits, what it is exposed to, how it is protected, what has happened before, what could happen next, and what should be done about it.
For a Tier 1 broker or insurer, this is not an IT project. It is the infrastructure for a fundamentally different kind of business — one that moves from managing insurance data to understanding risk, and from processing transactions to delivering intelligence.
The firms that build this capability early will not simply have better data.They will understand risk in a way their competitors cannot match.
References
Convr — Unleashing the Value of Underwriting Data with Knowledge Graphs
https://convr.com/resources/blog/unleashing-the-value-of-underwriting-data-with-knowledge-graphs/
Dun & Bradstreet Direct+ — Corporate Linkage API
https://docs.dnb.com/direct/2.0/en-US/linkage/3.1/orderproduct/linkage-rest-API
Moody’s Insurance Solutions — Location Intelligence API
https://insurance.moodysanalytics.com/products/location-intelligence-api
Marsh — Blue[i] Analytics and Risk Companion
https://www.marsh.com/
Neo4j — Insurance Use Cases
https://neo4j.com/developer/industry-use-cases/insurance/
Neo4j — Zurich Insurance Customer Story
https://neo4j.com/customer-stories/zurich-insurance/
Verisk — Catastrophe Modeling and Insurance Analytics
https://www.verisk.com/insurance/products/catastrophe-modeling/
Amazon Neptune Documentation
https://docs.aws.amazon.com/neptune/
Debezium Change Data Capture Documentation
https://debezium.io/documentation/
Microsoft Purview Data Lineage Documentation
https://learn.microsoft.com/en-us/purview/
About the author
Subash Mandanapu is a product and technology leader specializing in AI, enterprise data platforms, and commercial insurance. He is Director of Product Management at Marsh & McLennan, where he leads the teams behind AI agents for commercial insurance placement — and Blue[i], a predictive analytics platform. He has 9 years of software engineering experience across Ericsson, France Telecom R&D, and Symbian, co-founded Clip2Mobile, and holds 11 U.S. patents. He writes about AI agent architecture, risk intelligence, and the future of insurtech.