Member-only story
Claude Dashboards: Turning Agentic AI Chats Into a Live Reporting Tool
The new artifact template connects to your data warehouse, writes the SQL, and keeps every chart current


Dashboards have long been the meeting point between analysts and the people who need answers. A manager asks how signups compare to last month, an analyst writes a query, someone builds a chart, and a day or two later the answer arrives. That delay is a real cost for lean teams, especially small businesses and nonprofits that can’t staff a dedicated BI group.
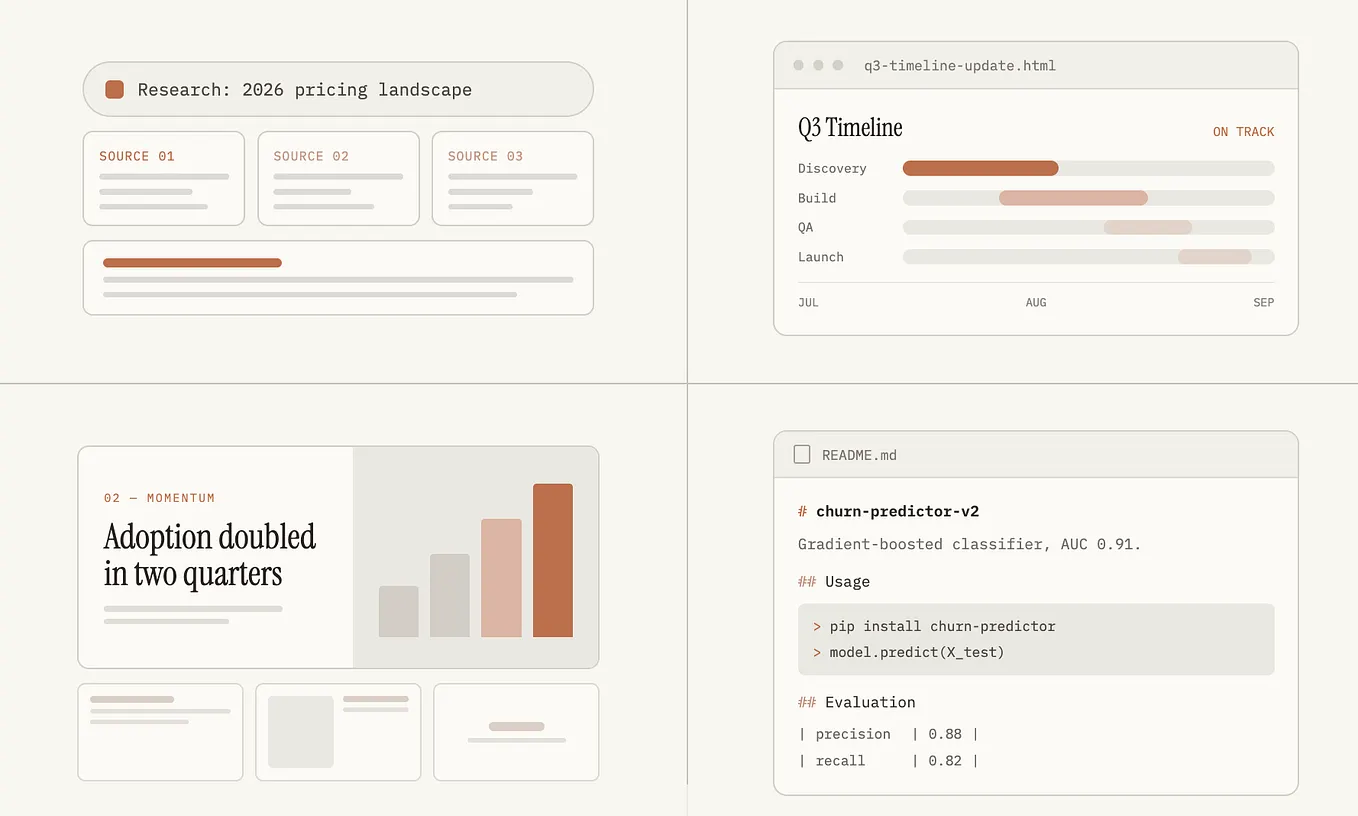
Anthropic is betting that a conversation can shorten that loop. On October 8, 2026, the company released Claude Dashboards in beta, alongside a companion feature called Claude Motion. A dashboard is now one of the artifact templates in Claude, sitting next to Docs, Slides, and Design. You connect a data source, ask a question in plain language, and Claude writes the queries and assembles the dashboard.
The release builds on an earlier idea. In April, Anthropic introduced live artifacts in Claude Cowork, pages that pulled fresh data from connectors each time you opened them. Those were limited to the desktop app. Dashboards turn that concept into a dedicated template that works in the browser, the desktop app, and the mobile app. Here’s a look at…