Using the IDS-DRR platform: A practical guide for making resource allocation decisions


The Intelligent Data Solution for Disaster Risk Reduction (IDS-DRR) is an open-source platform for India that helps disaster management authorities to make timely data-driven decisions, prioritize expenditure of public funds and conduct public procurement in a manner that strengthens long-term disaster risk reduction and protects the most vulnerable people from the adverse effects of extreme weather events. As of June 2026, the publicly available platform assesses flood risks while analytics for extreme heat are soon to be deployed.
In this guide, we offer six common questions you can answer with IDS-DRR to make decisions and allocate resources to districts to prepare or respond to floods. It will also guide you on how to find the information you need using https://drr.open-contracting.in.
The IDS-DRR website’s “Analytics” module currently allows users to explore flood risks in the state of Assam in detail. The “Datasets” section features a library of downloadable datasets on flood risk factors in five states: Assam, Bihar, Himachal Pradesh, Odisha, and Uttar Pradesh.
On IDS-DRR, various dimensions of resource allocations to mitigate flood risks can be assessed at the state, district and sub-district (revenue circle) level using objective indicators constructed from open-source datasets collated by Open Contracting Partnership and CivicDataLab.
On the IDS-DRR Analytics module, data can be visualized in different ways by changing the selected “View” using the tabs above the main chart:
- Map View: best for making comparisons across all districts in a specific month, or across revenue circles within one district
- Chart View: best for comparing changes over time in a district or revenue circle (using a bar or line chart)
- Table View: best for comparing risk indicator values across all districts, or across revenue circles within one district, in a specific month.
Interpreting the IDS-DRR dashboards requires an understanding of a few key dates:
- The pre-monsoon season typically runs from March to May (characterized by rising temperatures and increasing humidity)
- The monsoon season typically runs from June to September (bringing heavy rainfall)
- The post-monsoon season typically runs from late September to February (leading to dry conditions and occasional rain)
- Resource allocations, including State Disaster Response Funds, are typically decided at State Executive Committee (SEC) meetings, held three to four times a year
- The Indian Financial Year runs from April 1 to March 31.
How can I identify the districts most ‘at-risk’ of floods in my state?
The responsibilities of state disaster management authorities include state-wide budget planning and resource allocations to districts to manage disasters and build long-term resilience. IDS-DRR can help state officials to prioritize these investments by revealing which communities and areas are most at risk of flooding.
Flood risk can be assessed at the state, district and sub-district (revenue circle) level using objective indicators constructed from various open-source datasets.
Each area is allocated an overall flood risk (very low, low, medium, high, or very high risk), which is determined by four factors: hazard, exposure, vulnerability and government response.
For a simple overview of flood risks across the state of Assam in any given month, use the Actions > Download Report function on the left side menu to generate a report that includes the top “at-risk” districts, key insights and suggested actions.
On the Analytics dashboard, you can examine different risk scenarios: before, during and after flooding. For example, the monsoon season typically runs from July to September. So selecting the month of August 2025 offers a snapshot of flood risks across the state of Assam during the height of the monsoon season.
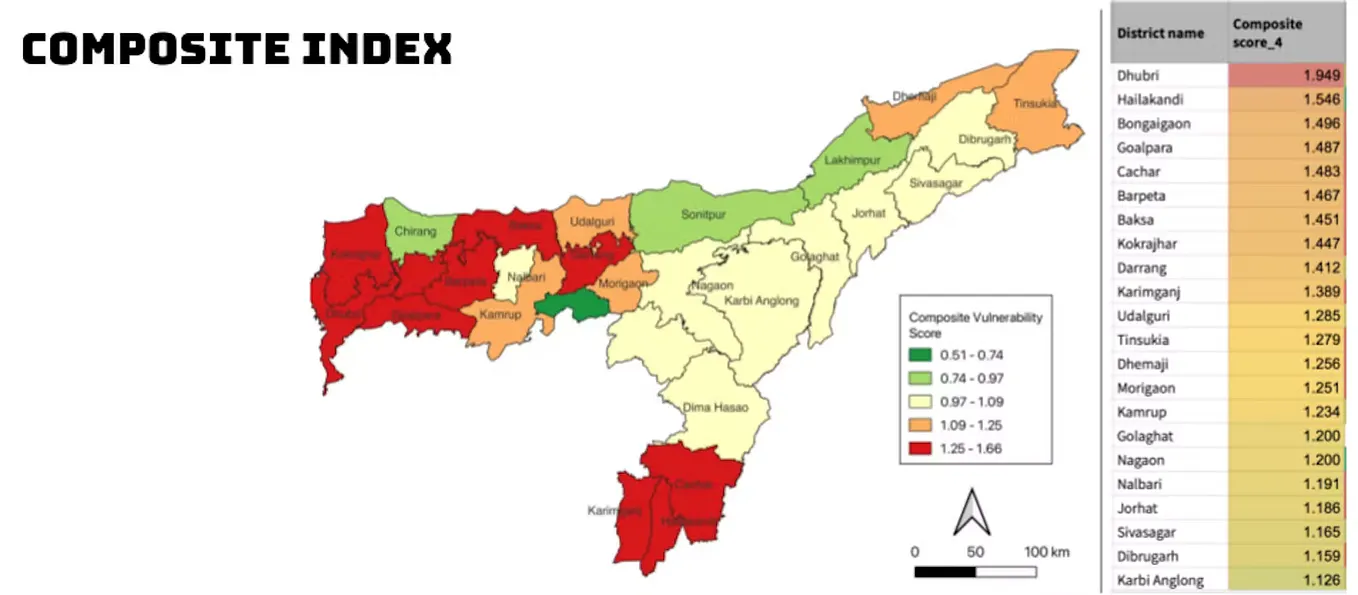
In August 2025, we can check the Map View to see that four districts have a very high overall flood risk (red): Karimganj, Dibrugarh, Lakhimpur and Cachar. Seven districts have a high overall flood risk (orange).

How can I identify the factors that influence overall flood risk in a district?
Understanding overall flood risk:
The overall flood risk (also known as the composite flood risk) is influenced by four risk factors: hazard, exposure, vulnerability and government response.

Using the Table View, we can see an overview of the factors that influence the overall flood risk levels across all 35 districts of Assam. In August 2025, four districts — Karimganj, Dibrugarh, Lakhimpur, and Cachar — carry a very high overall flood risk. Comparing their factor breakdowns shows how districts can arrive at the same overall risk rating through different combinations of hazard, exposure, vulnerability and government response.
Take Dibrugarh and Cachar as an example. In Dibrugarh, the likelihood of a flood event (hazard) is very high. Exposure risk is low so fewer people and households are likely to be affected than in Cachar, where exposure risk is very high. But vulnerability risk is high in Dibrugarh, so the impact on the population is likely to be more severe than in Cachar where vulnerability risk is medium. Government response risk is very high in both districts which means flood-related public expenditure is very low.
The Analytics dashboards rely on ratings (very low to very high) for ease of reading, but these categories alone won’t show you the precise ranking of districts in the same overall flood risk category. For an exact ranking, consult the Download Report. For example, four districts share a “very high risk” rating in August 2025, but we can only learn that Cachar is the single most at-risk district by checking the report (see Figure 3). The order is based on each district’s precise flood risk score, which is produced by combining the four factors using a ranking method called TOPSIS (Technique for Order of Preference by Similarity to Ideal Solution). Advanced users can access the raw data via GitHub. For more information on how the composite flood risk score is calculated and how the four factors are weighted, see the full methodology.

Further interpreting the four factors contributing to overall flood risk:
Each of the four factors has its own measurable indicators, e.g. monthly rainfall is an indicator of the factor hazard, or population is an indicator of the factor exposure. These factors and indicators are listed on the platform’s left side selection menu and can be used as filters to understand the specific drivers that influence an area’s overall flood risk rating in greater detail.

For example, by selecting Exposure and Table View (Figure 4), we can see that the exposure risk in Cachar is so high because it is the second most populous district in the state with more than 2 million people and has a relatively large number of households (>416,000).
Get CivicDataLab’s stories in your inbox
Join Medium for free to get updates from this writer.
In some circumstances, officials might apply a methodology with different weightings. In developing IDS-DRR, we assessed the correlation between the traditional Assam State Disaster Management Authority (ASDMA) risk assessment methodology and the IDS-DRR methodology. The traditional ASMDA methodology prioritizes hazard and vulnerability indicators. The IDS-DRR methodology factors in two additional dimensions: exposure and government response (i.e. coping capacity).
- How can I identify districts with the highest vulnerability risks in my state?
Vulnerability is an important dimension of disaster risk because it determines whether exposure to hazard actually turns into loss. It assesses how susceptible people and systems are to harm, and how much capacity they have to absorb, cope with, and recover from it.
To identify the districts with the highest vulnerability risks overall, we can select the Vulnerability indicator from the left selection menu and use the Map View. Three districts have very high vulnerability risks in August 2025: Hojai, Lakhimpur and Morigaon (see Figure 5).
A monsoon might adversely affect two districts simultaneously, but one might recover more rapidly depending on factors such as the quality of housing, public infrastructure, and the population of vulnerable groups such as elderly people and children.
Using the data from August 2025, the districts of Lakhimpur and Karimganj show the same overall flood risk level but Karimganj has a much lower vulnerability risk.
We can check the Table View to understand which sub-districts have the most concentrated vulnerability risks and which indicators influence them. In Lakhimpur, no fatalities have been reported (“Human Lives Lost”), but 814 hectares of crop area have been affected and two roads have been reported damaged by disaster events. Four out of seven revenue circles have very high vulnerability risks. Apart from reported impacts from disasters, other indicators that drive vulnerability risks include a very low ratio of households with piped water connections or fewer hours of electricity on average, or a large number of children.
These vulnerability indicators can help government officials determine what kind of projects to fund and where to implement them to most effectively reduce disaster risks.


We can use the Chart view to track changes in a district’s vulnerability over time, particularly by selecting a specific indicator (such as total infrastructure damages) from the left side menu. For example, if we select the district of Morigaon and select the months of June-September (monsoon season) for the years 2021 to 2025, then browse each indicator in the Vulnerability section, we learn that Morigaon suffered damage to infrastructure every monsoon season (Figure 7), and lives were lost in most years (Figure 8). Drilling down further using the “Select Revenue Circle” filter and the specific vulnerability indicators, we can see most of those damages and fatalities were in the revenue circle Mayong (Figure 9 & 10).


Which districts in my state received budget allocations or had projects approved and for how much?
On the IDS-DRR Analytics platform, we can assess how prepared the state is for a flooding event by consulting the indicators under the Government Response filter. Two types of data feed into the Government Response risk factor: tenders awarded and funds allocated.
Let’s look first at the funds allocated (indicator: “Total value of funds allocated through SDRF during SEC meetings”). The state government makes resource allocation decisions for disaster-related projects at quarterly State Executive Committee (SEC) meetings. At SEC meetings, state disaster management officials (ASDMA) review proposals from state departments and district officials seeking resources from the State Disaster Response Fund (SDRF) and other available funds. The data on SDRF funds allocated published on the IDS-DRR dashboard come from the minutes of the SEC meetings, where the details of proposed/approved projects and funds released are reported. It’s important to note that funds approved at SEC meetings can be both for long-term preparedness planning, as well as for repairs and restoration after a disaster event. Resources allocated in one SEC meeting could be related to expenditures for many different flood events over several years. This means SDRF fund allocations are best used as a long-term indicator of resources reaching districts over many years, rather than in the short term directly after one disaster event.
Now, let’s consider the tenders awarded. The data for these indicators come from flood-related tenders that we could identify and process from Assam’s e-procurement system, using keyword matching. Tenders are a good measure of how the resources allocated at SEC meetings are actually used and when. On the IDS-DRR platform, there are five indicators for tenders awarded. The first indicator “Total Flood Tenders Value” shows the sum of spending on all categories of flood-related tenders. The four indicators that follow each show spending for a specific tender category: “flood tenders under SDRF”, “repairs and restoration”, “immediate measures”, and “other”. Tagging of tenders by their funding source (e.g. SDRF) can be inconsistent, so it’s important to remember that the values reflect only the flood-related tenders that could be identified and classified.
Continuing with our example from previous questions, we can use the Government Response indicators to assess how prepared the state is for a flooding event in August 2025. If we use the Map View and select the indicator “Total value of funds allocated through SDRF during SEC meetings,” we can see that as of August 2025, Dhubri was the only district of Assam allocated funding so far in the 2025 Fiscal Year, receiving ₹1,028,571 (around US$10,000), see Figure 11. Thus, Dhubri has a “very low” Government Response risk rating because it is likely to be better prepared than other districts if it is hit by a flood in August 2025.

We can use the Chart View (Figure 12) to check when the SDRF funds were allocated, and verify this by checking the SEC Meeting Minutes for that quarter. The details of the projects funded in Dhubri are listed in Minutes of the 53rd SEC meeting (annexure II) held on April 9, 2025.

Up until August 2025, none of our four top “at risk” districts during the monsoon season had received SDRF funds in the 2025 financial year. Two of the top at-risk districts received SDRF funding in October 2025 and all four received funding in January 2026. This suggests resources were allocated to these districts at the two meetings following the monsoon season. The minutes for the 54th and 55th SEC meetings provide further details.
To understand these districts’ preparedness over the longer term, we can consult the SDRF fund allocation data for previous years. For example, the government response risk for Cachar is very high in March (end of the financial year) 2022 to 2025. The only months it received SDRF funding were January and March 2022 (see Figure 13). This was before IDS-DRR was released (late 2022), so it could not have informed any allocation decisions back then. In January 2026, Cachar dropped to very low government response risk after receiving 220 million rupees (US$2.29 million) in disaster response funding (SDRF) and awarding flood-related tenders for immediate measures.

The tenders awarded indicators add another dimension. The “Total Value of Flood Tenders”, shows one of the four top at-risk districts, Dibrugarh, awarded flood-related tenders in August 2025.
But we should also look at a district’s longer term trends in awarding flood-related tenders. For example, to check flood-related tenders awarded in Cachar over five years, use the Chart View and select the “Total Value of Flood Tenders” indicator. Select the district and multiple months to create a bar chart with total flood tender spending per month (see Figure 14). In Cachar, spending was highest in May 2023. Checking the other tender indicators shows that some of this spending could be linked to “immediate measures”.
For granular information about these tenders, including procurement method, tender descriptions, bidder names, award price, location etc., and seasonality, we can check the data exports on the Datasets page (e.g. Assam flood related tenders geotagged and processed; data available until August 2024). For example, the procurement from Cachar in May 2023 is described in the tender dataset as “Construction of RCC Ramp G3 foundation provision for emergency exit of 40 bedded ICU over 3 floor of South block including linking of first floor second floor of South block Central block at SMCH, Silchar GrIII”.

How can I tell if the approved budgets or projects were for districts with the highest vulnerability or experienced the greatest losses and damages?
Typically, we would expect to see SDRF funds being allocated to a district in SEC meetings following impacts from a disaster event but there may be a significant lag between when the projects are executed and when the funds are approved. For example, Dhubri was the only district identified as receiving SDRF funding in the SEC meeting held in April 2025. The minutes of the meeting list projects in Dhubri approved under SDRF for the year 2023–24. Using the Chart View, we can check any changes to Dhubri’s flood risks which may have informed this decision to allocate SDRF funding (select “Overall Flood Risk” from the indicator panel, select the district Dhubri and months April 2023 to April 2025, then use the icons above the chart to switch to the line chart view). As illustrated in Figure 15, hazard risks in Dhubri reached a very high risk level in September 2023 and over three months in 2024. At times, its vulnerability risk was rated medium. By checking each individual vulnerability indicator, we can see some damages in the 2023 monsoon season, and a higher number of losses and damages in July 2024: nearly 500,000 total population affected, four lives lost, 671 hectares of crop area affected, 218 roads damaged and one bridge.

Different indicators give me different answers for districts at risk. How can I use multiple different indicators to identify which districts to prioritize when approving new projects or investments?
Determining which district is most “at-risk” will depend on the lens of the department leading the intervention to reduce an area’s vulnerability to flooding. For example, the State Water Resource Department might be interested in household water connections, while the Department of Agriculture might be more interested in crop and livestock losses or the farming community. Depending on who is using the platform and their mandate, the prioritization of indicators will vary. The dashboards are currently designed for disaster management officials, but we are exploring potential use cases for other government agencies too.
This resource was developed by Open Contracting Partnership and CivicDataLab as part of our joint project to develop a data-driven framework for managing disaster risks. Access the PDF.